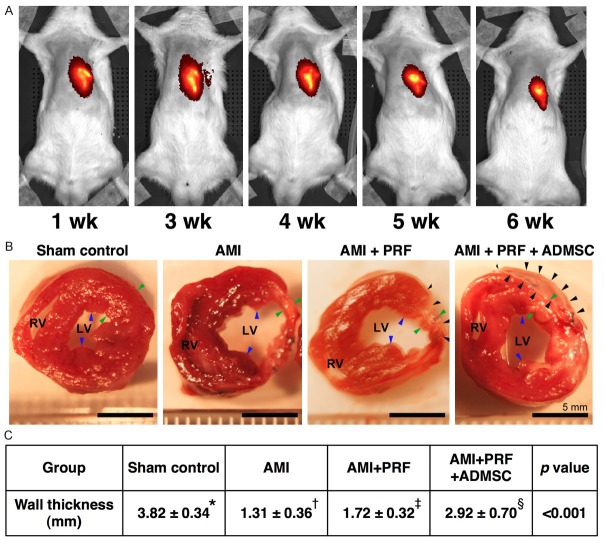
Figure 2.
Illustration of IVIS study and anatomical and pathologicalfindings on day 42 after AMI induction (n = 8). A. Serial assessmentsof living imaging by In Vivo Imaging System (IVIS) after acute myocardial infarction (AMI). B. The anatomical findings showed the cross-section areaof the heart at the papillary muscle (blue arrows) among the four groups.The left ventricular (LV) chamber size was highest in AMI group, lowest in sham-control group, and notably higher in AMI + platelet-rich fibrin (PRF) group than in AMI + PRF + adipose-derived mesenchymal stem cell (ADMSC);Conversely, the infarct size showed an apposite pattern of LV chamber size.The black arrows indicated PRF scaffold tissue in AMI + PRF group and ADMSC-embedded PRF scaffold (AMI + PRF + ADMSC) (i.e., engineered ADMSC grafts) group, respectively.Scale bars in right lower corners represent 5 mm. C. *vs. other groups with differentsymbols (*, †, ‡, §), p < 0.001. Statistical analysis using one-way ANOVA, followed by Bonferroni multiple comparison post hoc test. Symbols (*, †, ‡, §) indicate significance (at 0.05 level).

