
Figure 8.
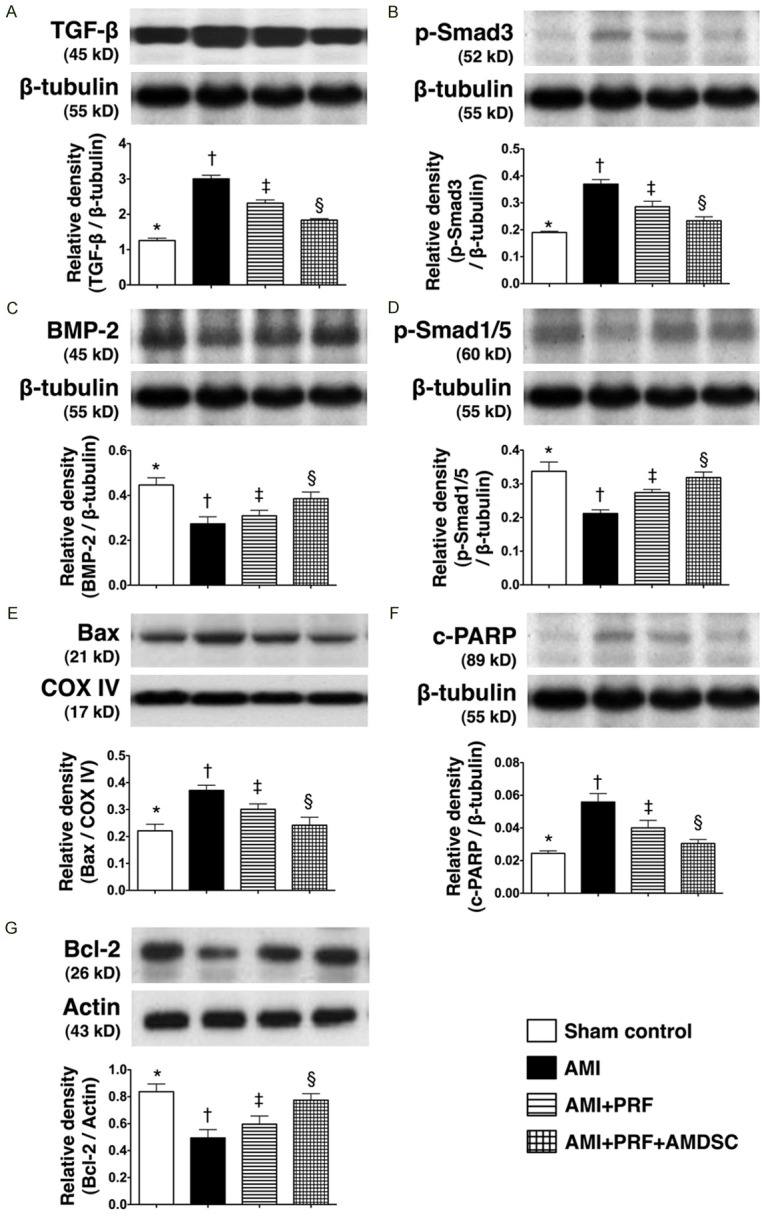
Protein expressions of fibrotic, anti-fibrotic, apoptotic and anti-apoptotic biomarkers in infarct area of LV myocardium on day 42 after AMI induction (n = 8). A. The protein expression of transforming growth factor (TGF-β). *vs. other groups with different symbols (*, †, ‡, §), p < 0.001. B. The protein expression of Smad3. *vs. other groups with different symbols (*, †, ‡, §), p < 0.01. C. The protein expression of bone morphogenetic protein (BMP)-2. *vs. other groups with different symbols (*, †, ‡, §), p < 0.005. D. The protein expression of Smad1/5. *vs. other groups with different symbols (*, †, ‡, §), p < 0.01. E. The protein expression of Bax. *vs. other groups with different symbols (*, †, ‡, §), p<0.01. F. The protein expression of cleaved poly(ADP-ribose) polymerase (c-PARP). *vs. other groups with different symbols (*, †, ‡, §), p < 0.01. G. The protein expression of Bcl-2. *vs. other groups with different symbols (*, †, ‡, §), p < 0.01. Statistical analysis using one-way ANOVA, followed by Bonferroni multiple comparison post hoc test. Symbols (*, †, ‡, §) indicate significance (at 0.05 level).