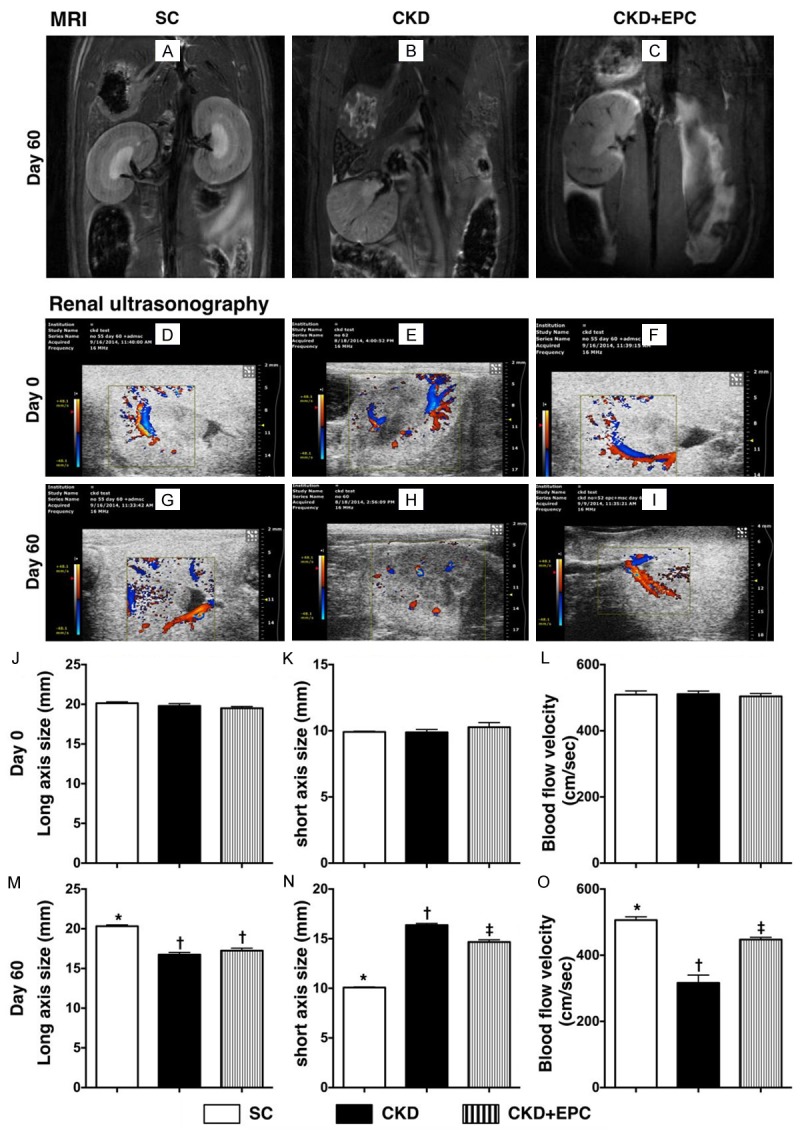
Figure 3.

Imaging findings of left kidneys among the three groups by day 60 after CKD induction (n = 10). A-C. Illustrating the magnetic resonance imaging (MRI) finding (coronal section) of left renal parenchymal structure. The MRI results showed that gross anatomical feature (i.e. bean shaped) morphological feature of cross section (i.e., the pelvis calyces, medulla and cortex) of kidney were lost in CKD, partially preserved in CKD-EPC and intact in SC. D-F. Illustrating the abdominal ultrasound findings of blood flow in the kidney by day 0 prior to CKD induction. The blood flood was homogeneous and did not differ among the three groups. G-I. Illustrating the abdominal ultrasound findings of blood flow in the kidney by day 60 after CKD induction. The blood flood was remarkably lower in CKD (H) group than the other groups. J-L. By day 0, the long axis size (J), short axis size (K) and the blood flow velocity of left kidney did not differ among the three groups. M. The analytical result of long axis size of left kidney by day 60 after CKD induction, * vs. †, p < 0.001. N. Analytical result of short axis size of left kidney by day 60 after CKD induction, * vs. other groups with different symbols (*, †, ‡), * vs. †, p < 0.0001. O. The analytic results of blood flow velocity of left kidney by day 60 after CKD induction, * vs. other groups with different symbols (*, †, ‡), * vs. †, p < 0.0001. All statistical analyses were performed by one-way ANOVA, followed by Bonferroni multiple comparison post hoc test. Symbols (*, †, ‡) indicate significance (at 0.05 level). SC = sham control; CKD = chronic kidney disease; EPC = endothelial progenitor cell.
