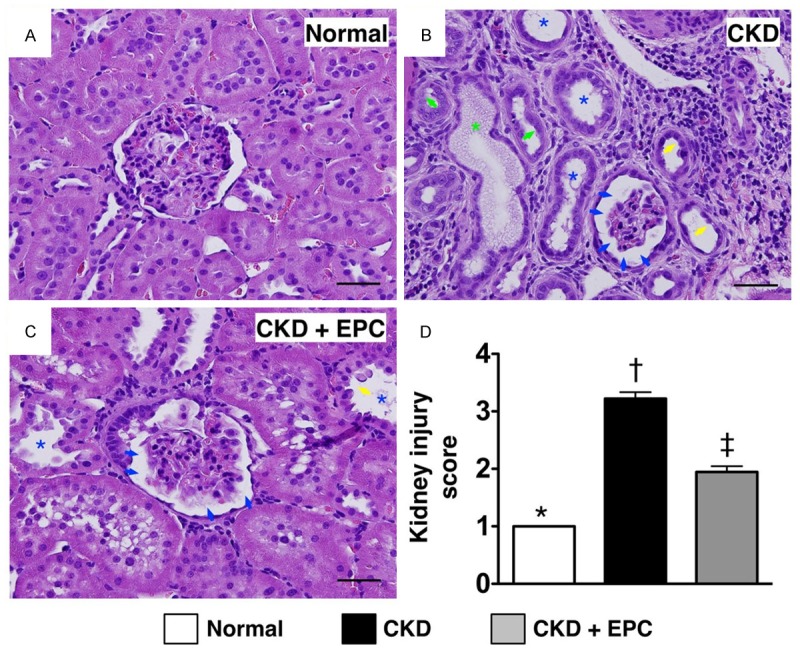
Figure 4.

Histopathological findings of kidney injury by day 60 after CKD induction (n = 10). A to C. H. & E. stain (200 ×) demonstrating significantly higher degree of loss of brush border in renal tubules (yellow arrows), cast formation (green asterisk), tubular dilatation (blue asterisk) tubular necrosis (green arrows), and dilatation of Bowman’s capsule (blue arrows) in CKD group than in other groups. D. * vs. other groups with different symbols (*, †, ‡), * vs. †, p < 0.0001. All statistical analyses were performed by one-way ANOVA, followed by Bonferroni multiple comparison post hoc test. Symbols (*, †, ‡) indicate significance (at 0.05 level). Scale bars in right lower corner represent 50 µm. SC = sham control; CKD = chronic kidney disease; EPC = endothelial progenitor cell.
