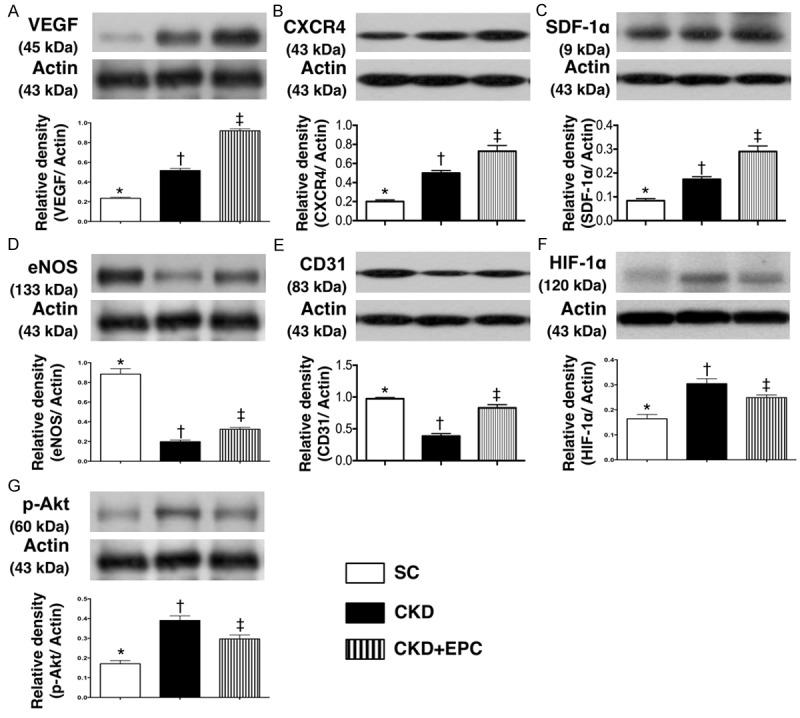
Figure 7.

Protein Expressions of Pro-angiogenic Factors in Kidney Parenchyma by Day 60 after CKD Induction (n = 10). A. Protein expression of vascular endothelial growth factor (VEGF), * vs. other groups with different symbols (*, †, ‡), * vs. †, p < 0.0001. B. Protein expression of CXCR4, * vs. other groups with different symbols (*, †, ‡), * vs. †, p < 0.0001. C. Protein expression of stromal cell-derived factor (SDF)-1α, * vs. other groups with different symbols (*, †, ‡), * vs. †, p < 0.0001. D. Protein expression of eNOS, * vs. other groups with different symbols (*, †, ‡), * vs. †, p < 0.0001. E. Protein expression of CD31, * vs. other groups with different symbols (*, †, ‡), * vs. †, p < 0.01. F. Protein expression of hypoxic inducible factor (HIF)-1α, * vs. other groups with different symbols (*, †, ‡), * vs. †, p < 0.01. G. Protein expression of phosphoryated (p)-Akt, * vs. other groups with different symbols (*, †, ‡), * vs. †, p < 0.0001. All statistical analyses were performed by one-way ANOVA, followed by Bonferroni multiple comparison post hoc test. Symbols (*, †, ‡) indicate significance (at 0.05 level). Scale bars in right lower corner represent 50 µm. SC = sham control; CKD = chronic kidney disease; EPC = endothelial progenitor cell.
