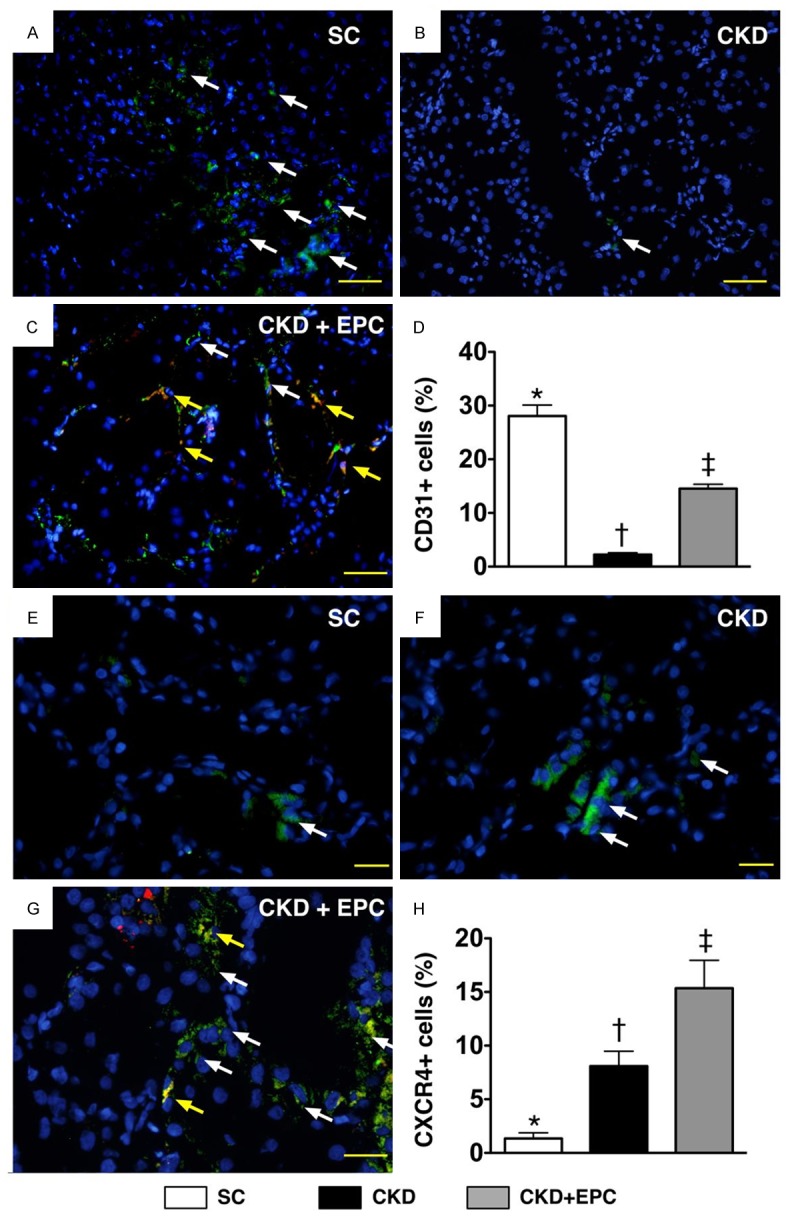
Figure 10.

Immunofluorescent (IF) stains of presence of CD31+ and CXCR4+ cells in renal parenchyma at day 60 after CKD induction (n = 8). A to C. IF staining (200x) of CD31+ cells (white) in renal parenchyma. Merged image from double staining (Dil dye + CD31) (C) showing cellular elements of mixed red and yellow (red arrows) under higher magnifications [(b) being magnified image of (a)], indicating transplanted numerous doubly-stained cells (CD31+) in peri-tubular and interstitial areas. DAPI counter-staining for nuclei (blue). Scale bars at right lower corner represent 50 µm. D. * vs. other groups with different symbols (*, †, ‡), p < 0.0001. E to G. IF staining (400 ×) of CXCR+ cells (white) in renal parenchyma. Merged image from double staining (Dil dye + CXCR4) showing cellular elements of mixed red and yellow (red arrows) under higher magnifications [(c) being magnified images of (d)], indicating implanted doubly-stained cells (CDCR4+) in peri-tubular and interstitial areas. DAPI counter-staining for nuclei (blue). Scale bars at right lower corner represent 20 µm. H. * vs. other groups with different symbols (*, †, ‡), p < 0.0001. All statistical analyses were performed by one-way ANOVA, followed by Bonferroni multiple comparison post hoc test. Symbols (*, †, ‡) indicate significance (at 0.05 level). Scale bars in right lower corner represent 50 µm. SC = sham control; CKD = chronic kidney disease; EPC = endothelial progenitor cell.
