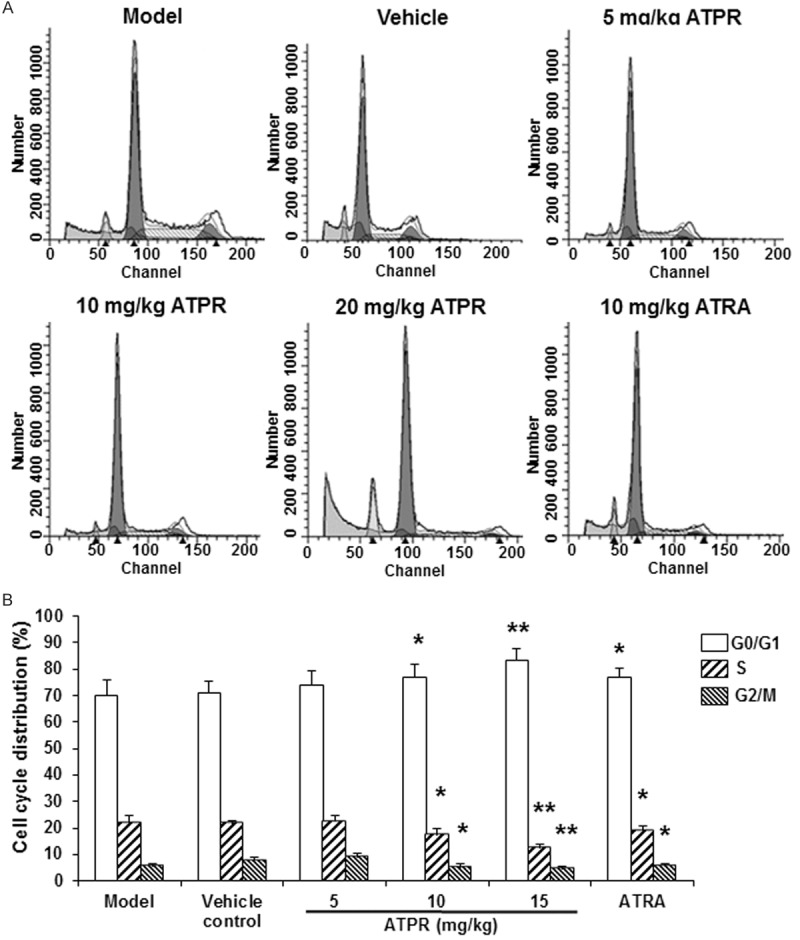
Figure 4.

ATPR changed the tumor cell cycle in xenograft mouse models. A. Representative flow cytometric histograms for tumor cell cycle analysis. B. Statistical analysis of the cell proportions of the tumor cells. n = 8. Compared with the vehicle control group, *P < 0.05, **P < 0.01.
