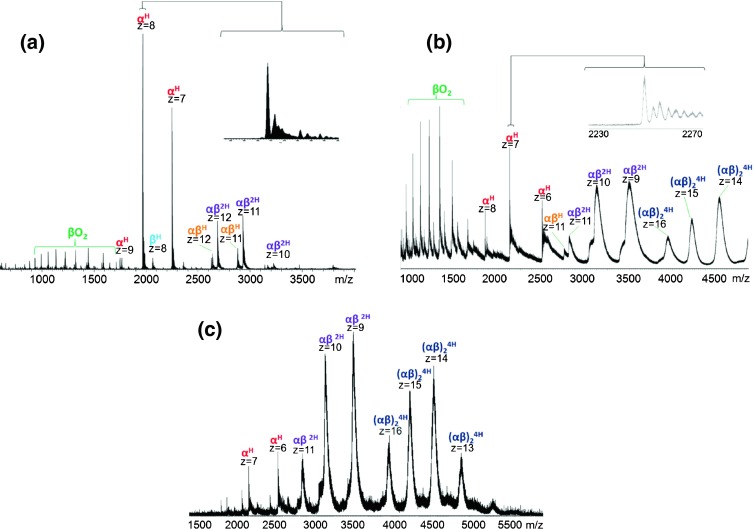
Figure 4.

Native LESA mass spectra of hemoglobin from dried blood spots: (a) Orbitrap mass analyzer; (b) Q-TOF mass analyzer; (c) ‘contact’ LESA with Q-TOF mass analyzer

Native LESA mass spectra of hemoglobin from dried blood spots: (a) Orbitrap mass analyzer; (b) Q-TOF mass analyzer; (c) ‘contact’ LESA with Q-TOF mass analyzer