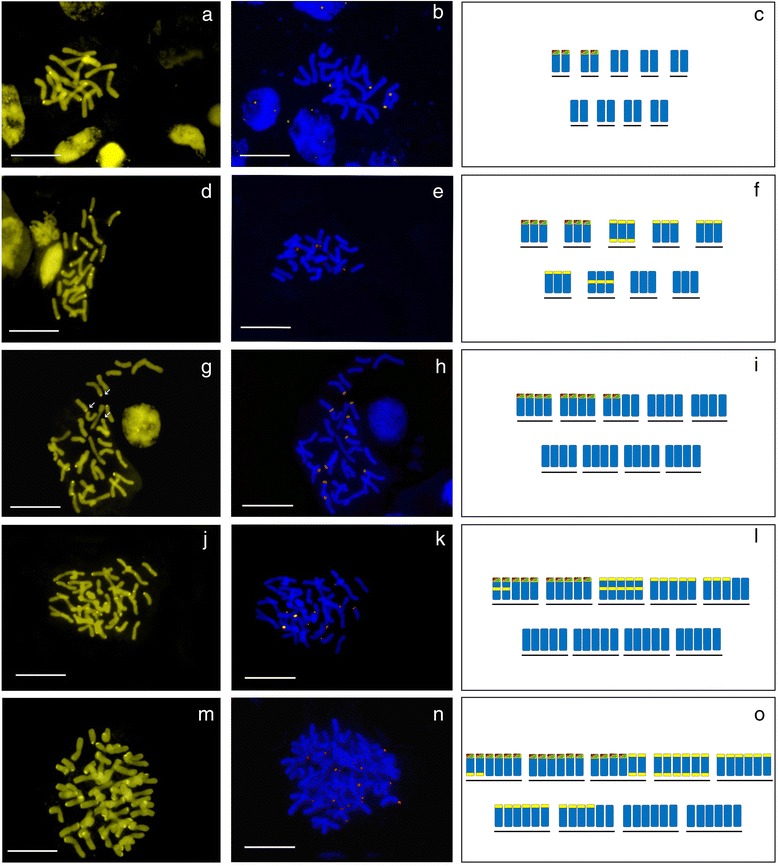
Fig. 2.

Chromomycin A3-positive (CMA+) and FISH images of the most commonly found metaphases of representative species of each ploidy level in Tanacetum. CMA+ bands are marked yellow, 26S-5S rDNA signals, marked orange in images. CMA+ positive bands are marked yellow, 26S-5S rDNA signals, are marked red-green in the schematic representation of chromosomes. (a, b, c) Tanacetum pinnatum, 2x population (Asad Abad, 1895) showing four CMA+ and four rDNA signals; (d, e, f) T. kotschyii, 3x population (Urmia, 1129) showing up to 24 CMA and six rDNA signals; large CMA+ bands indicated with asterisks; (g, h, i) T. oligocephalum, 4x population (Mamakan, 1911), showing 10 CMA+ and 10 rDNA signals; large CMA+ bands indicated with asterisks and faint bands indicated with arrows; (j, k, l) T. fisherae, 5x population, showing up to 30 CMA+ and 10 rDNA signals; large rDNA signals indicated with asterisks; (m, n, o) T. tabrisianum 6x population (Ahar, 1906), showing up to 50 CMA+ and 16 rDNA signals; large rDNA signals indicated with asterisks. Scale bars = 10 μm
