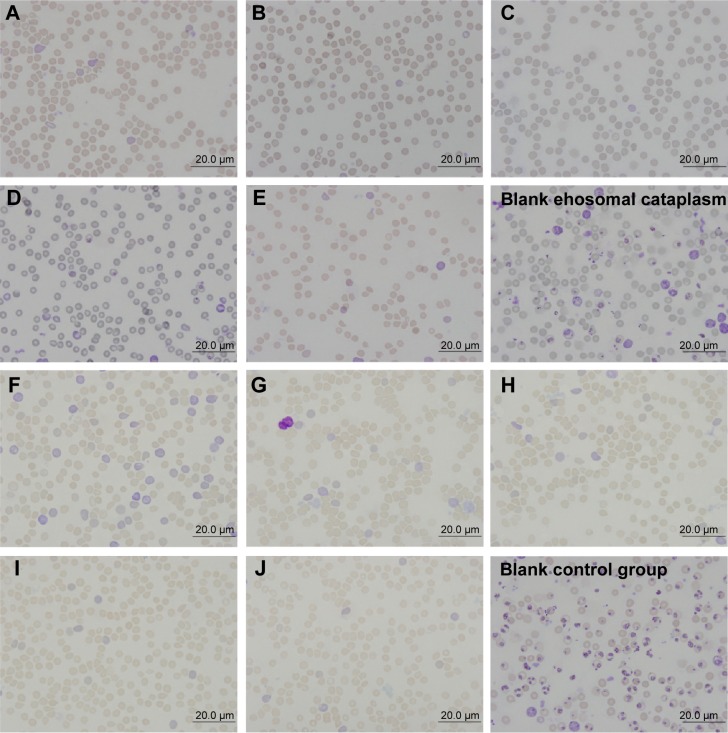
Figure 12.
The optical microscope pictures of thin blood smears.
Notes: Blank ethosomal cataplasm, blank control group and treatment groups (A–J) are shown. (A–E) Treated with conventional cataplasm; (F–J) treated with ethosomal cataplasm; specific administration dosages showed in Table 1.

