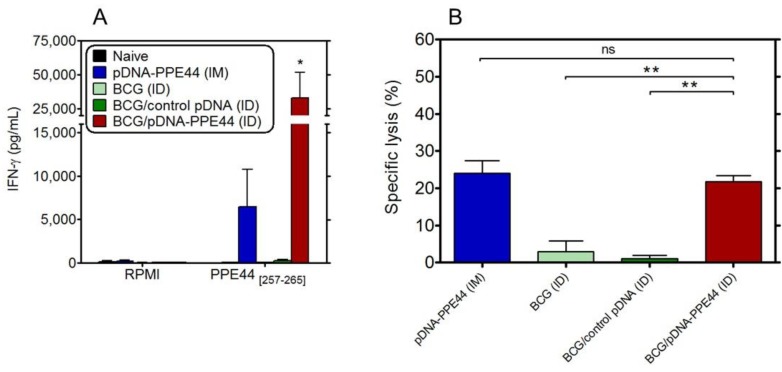
Figure 3.
Specific CD8+ T-cell responses induced by BCG/pDNA co-vaccination. (A) IFN-γ levels (pg/mL) were measured by ELISA in 72 h culture supernatant of splenocytes cultured with the PPE44 MHC Class I-restricted short peptide spanning amino acids 257–265 (PPE44[257–265]). RPMI, non-stimulated cells. Data are presented as the mean ± standard error of the mean and representative of two independent experiments, including six mice per group. * p < 0.05. (B) In vivo-specific cytotoxic T lymphocyte (CTL) activity. Unpulsed splenocytes (carboxyfluorescein diacetate (CFSE)low) and peptide-pulsed splenocytes (CFSEhigh) from naive mice were intravenously transferred to the immunized mice 18 h before flow cytometry analysis. Splenocytes were pulsed with the PPE44 MHC Class I-restrictedshort peptide spanning amino acids 257–265. The percentages of specific lysis in the immunized mice were compared to the ratio in transferred naive control mice. Data represent the mean ± standard error of the mean (n = 3–6/group). ** p < 0.005. ID, intradermally. IM, intramuscularly.

