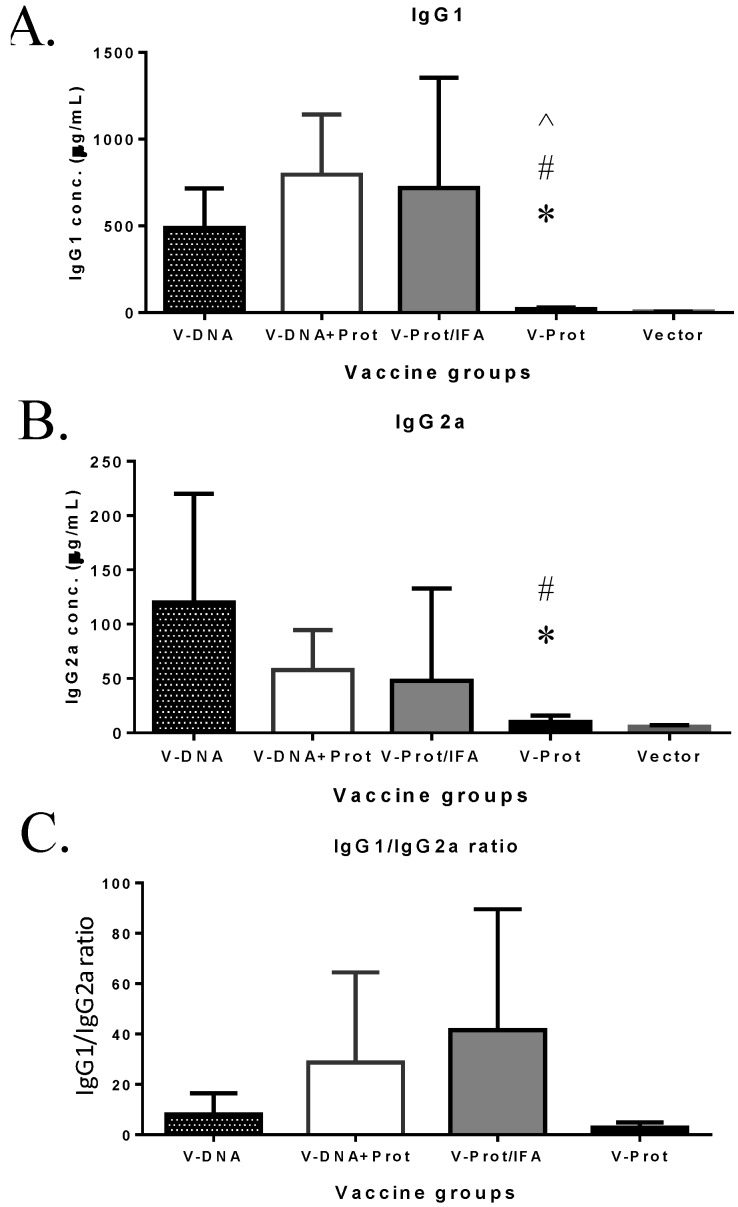
Figure 4.
V-specific IgG1 and IgG2a responses induced by various V vaccine regimens in mice: codon optimized V DNA vaccine alone (V-DNA), V DNA vaccine prime followed by V protein boost formulated with IFA (V-DNA + Prot/IFA), V protein formulated with IFA (V-Prot/IFA), V protein alone (V-Prot), or empty DNA vaccine vector alone (Vector). V-specific IgG1 (Panel A) and IgG2a (Panel B) concentrations were measured by ELISA against V protein in mouse sera collected at 2 weeks after the boost (2nd) immunization. Each bar represents the mean IgG concentrations in each group of 5 mice with standard error. Statistically significant differences (p < 0.05) are indicated as “*”, “#” or “^” when comparing V-DNA, V-DNA + Prot/IFA, and V-Prot/IFA groups. Panel C: IgG1/IgG2a ratios determined at 2 weeks after the boost immunization. Each bar represents the mean IgG1/IgG2a ratios in each group of 5 mice with standard error.

