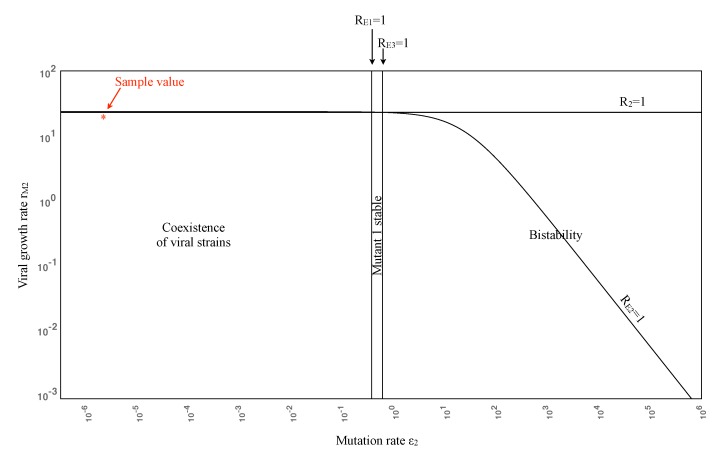
Figure 1.
Viral persistence landscape diagram as Mutant 2 varies, showing that an increase in the mutation rate of Mutant 2 can stabilize the Mutant 1 equilibrium. The bistability region is included for completeness, but corresponds to unreasonably high mutation rates. Note the log scale on the axes.

