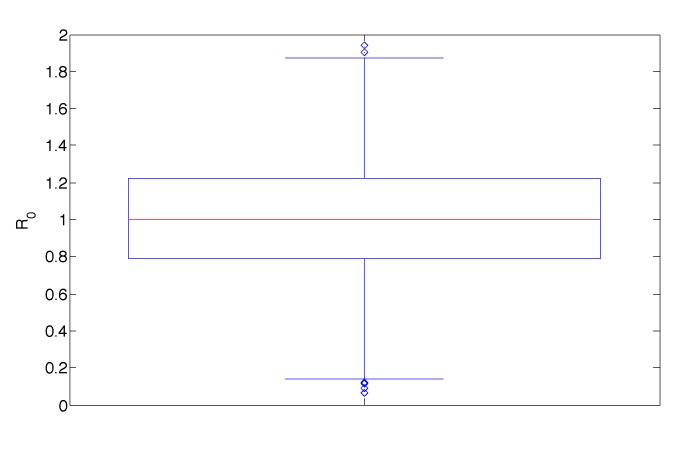
Figure 9.
Box plot of distribution of R0 values as all parameters are varied throughout their ranges in Table 1 with m = 1. The median value of R0 is almost exactly one, suggesting that small variations in parameters can result in either viral persistence or eradication.

