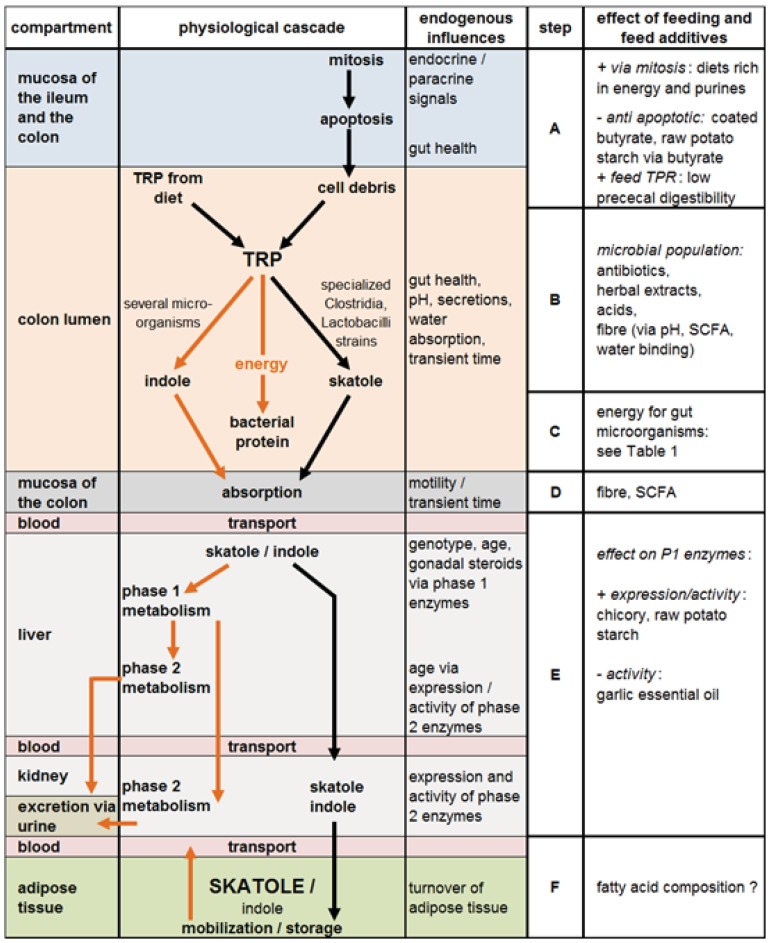
Figure 2.
Cascade of physiological events leading to skatole formation, further metabolism and accumulation of skatole in adipose tissue. Steps correspond to Sections 3.1 (A) to 3.6 (F). The right column shows where distinct feeding influences exert their effects. Black arrows: steps leading to high skatole concentrations; brown arrows: skatole reducing or neutral conditions.

