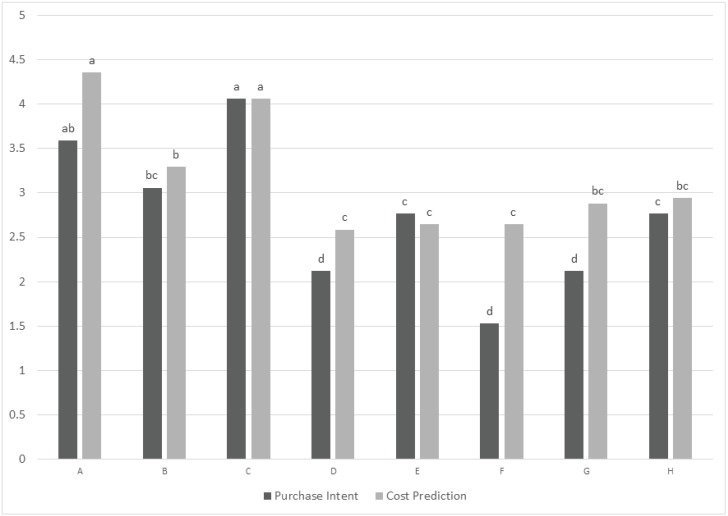
Figure 2.
Cluster 2: purchase intent (1 = definitely would not purchase by consumers, 3 = may or may not purchase, 5 = definitely would purchase), predicted cost (1 = not at all expensive to 5 = very expensive). Different letters within a variable indicate a significant difference among the samples (P < 0.05).

