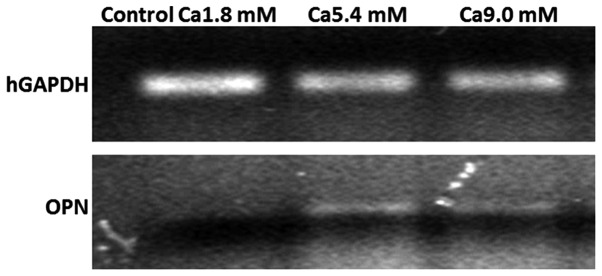
Figure 2.

Reverse transcription quantitative polymerase chain reaction analysis of OPN gene expression. A representative agarose gel is shown. OPN was not expressed in the control group, while OPN mRNA levels were upregulated in the Ca2+-treated groups. OPN, osteopontin.
