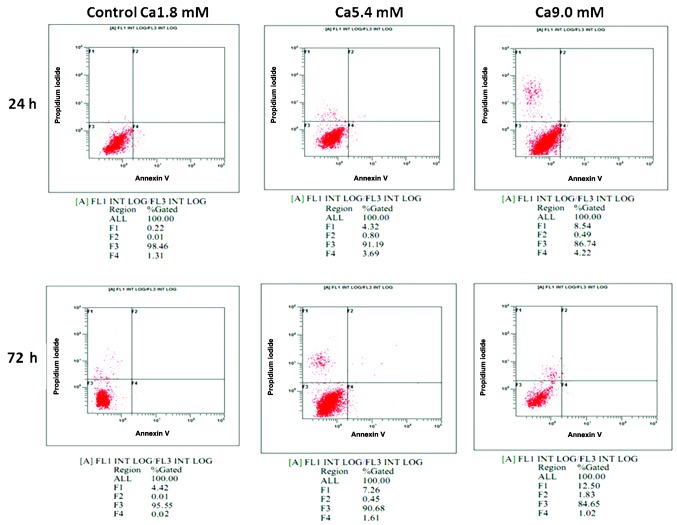
Figure 4.
Detection of cell apoptosis. Representative scatter photos are shown. Apoptosis was quantified by fluorescence-assisted cell sorting analysis after staining with Annexin V and PI at 24 or 72 h. Viable cells were Annexin V−/PI− (F3), early apoptotic cells were Annexin V+/PI− (F4), late apoptotic cells were Annexin V+/PI+ (F2) and necrotic cells were Annexin V−/PI+ (F1). The cells treated with higher concentrations of calcium ions showed higher apoptotic and necrotic rates compared with those in the control group. PI, propidium iodide.

