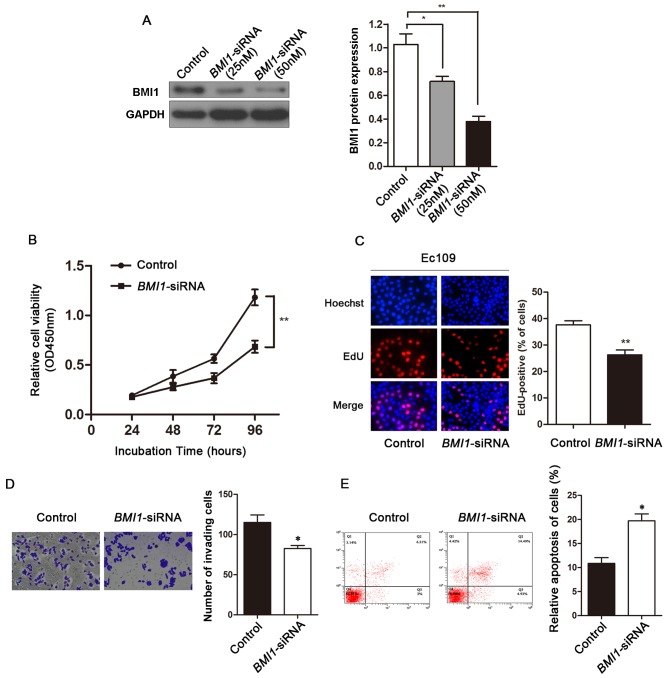
Figure 4.
Effects of the downregulation of BMI1 expression on the phenotype of EC109 cells. (A) Determination of BMI1 protein levels by western blot analysis. EC109 cells were transfected with 25 nM BMI1-siRNA, 50 nM BMI1-siRNA or control oligo. GAPDH was used as a loading control. The relative values of BMI1 expression in the cells were calculated following normalization to GAPDH using ImageJ software. (B) MTT assay of EC109 cell growth at different time points (24, 48, 72 and 96 h) following transfection with BMI1-siRNA or control oligo. (C) Effect of BMI1 on EC109 cell proliferation determined by EdU staining. (D) Transwell invasion assay of EC109 cells transfected with BMI1-siRNA. (E) Effect of BMI1 on EC109 cell apoptosis determined by flow cytometry. Data are presented as the means ± SD from 3 replicate samples. *P<0.05 and **P<0.01 vs. control.

