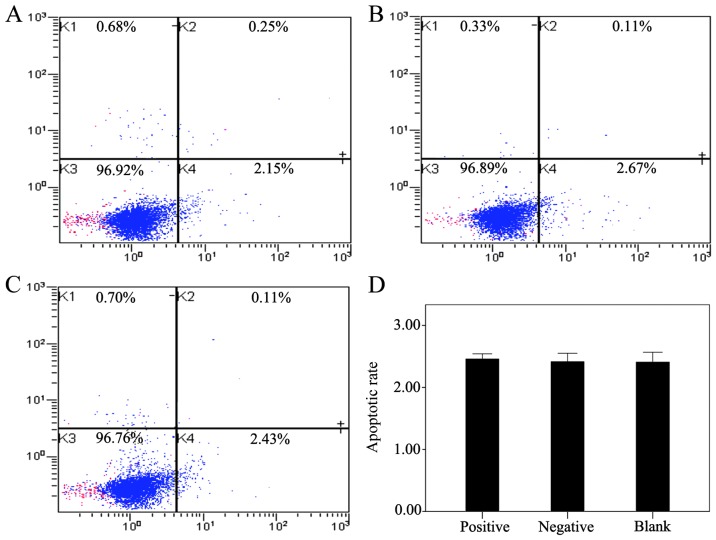
Figure 6.
The apoptotic rate of nucleus pulposus (NP) cells following transfection with lentivirus (LV) carrying survivin was analyzed by flow cytometry. (A–C) The apoptotic rate is represented as the percentage of the total cell population. The proportion of dead cells (Annexin V−/PI+), live cells (Annexin V−/PI−), early apoptotic cells (Annexin V+/PI−) and late apoptotic/necrotic cells (Annexin V+/PI+) was measured for comparison. (A–C) NP cells from passage 2 following transfection in the positive control (LV with survivin), negative control (empty LV) or the blank control (equal amount of DMEM/F12 medium), respectively. (D) Histogram showing the results of statistical analysis shows the apoptotic rate of the NP cells following transfection (p>0.05).

