Figure 6.

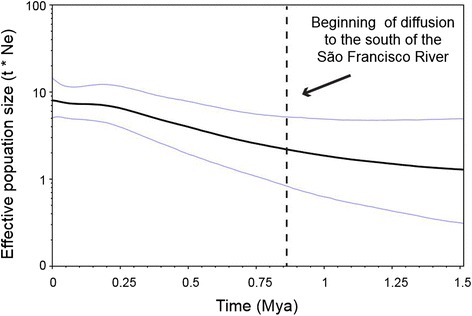
T. semitaeniatus complex effective population size through time based on the Bayesian Skyride. Area delimited by the blue line represented the 95%-HPD interval.

T. semitaeniatus complex effective population size through time based on the Bayesian Skyride. Area delimited by the blue line represented the 95%-HPD interval.