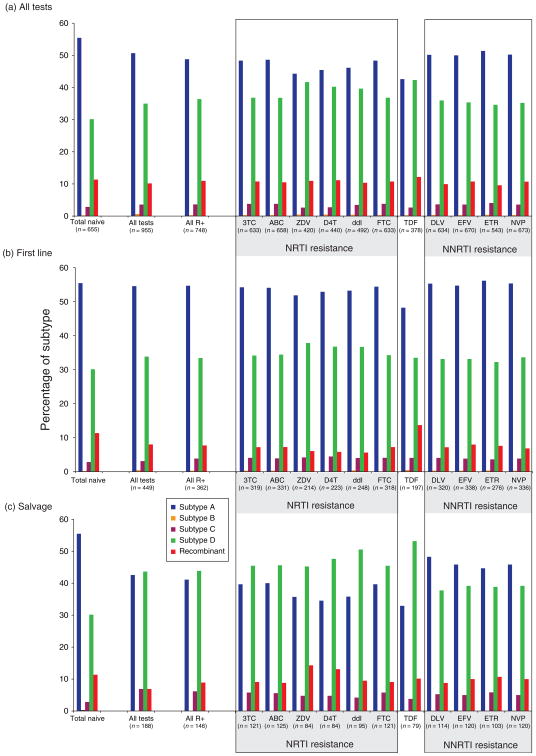
Fig. 4. Comparing the distribution in HIV-1 subtypes in the treatment-naive population and in patients failing antiretroviral treatment.
The percentage of subtypes A, B, C, D, and unique recombinant forms in the treatment naive population is shown as the first set of bars in panels a, b, and c. Percentage of subtypes in all DRG tests performed on reverse transcriptase coding region are in the second set of bars followed by the subtype percentage in only those samples harboring primary drug resistance mutations. The next set of bars describes the subtype percentages in those samples harboring primary resistance mutations to a specific nucleoside reverse transcriptase inhibitor (NRTI), tenofovir (TDF), and nonnucleoside reverse transcriptase inhibitor (NNRTI). Panel (a) describes the subtype distributions for all patient samples failing any antiretroviral treatment regimen, (b) only those failing first line HAART (one NNRTI + one cytidine analog + one thymidine analog), and (c) only those failing a second line or subsequent salvage regimens. ABC, abacavir; D4T, stavudine; ddI, didanosine; DLV, delaviridine; EFV, efavirenz; ETR, etravirine; FTC, emtricitabine; NVP, nevirapine; TDF, tenofovir; ZDV, zidovudine; 3TC, lamivudine.

