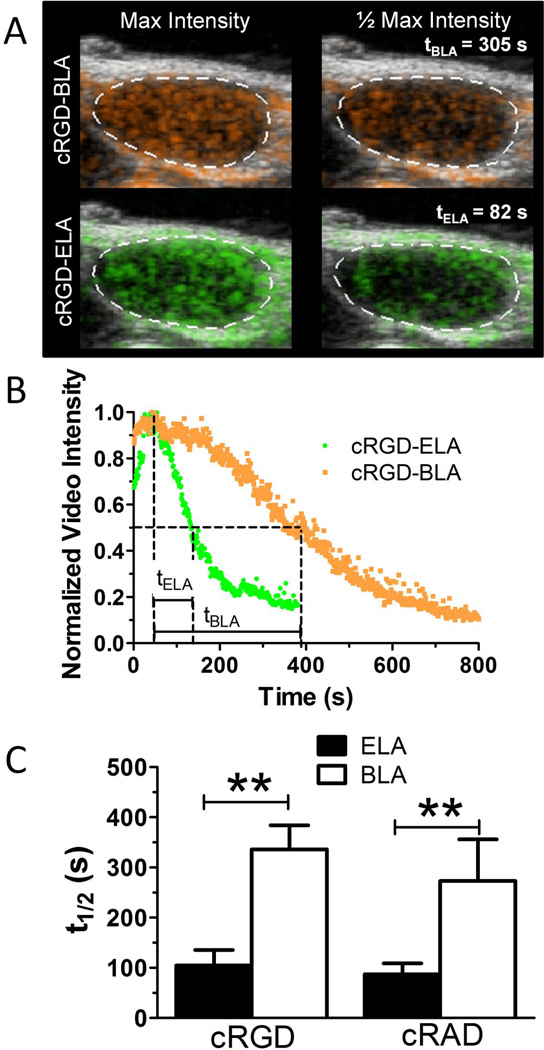
Figure 2.
Microbubble circulation persistence. A, Representative ultrasound images showing a two-dimensional image plane with color contrast from microbubble signals overlay onto grayscale B-mode images. B, Representative normalized time-intensity curves showing maximum and half-amplitudes. C, Analysis of total ultrasound contrast persistence in the tumor volume without ultrasound radiation force showed that buried-ligand microbubbles circulated approximately threefold longer than exposed-ligand microbubbles (cyclo Arg- Gly-Asp [cRGD], p < .001, n ≥ 5; cyclo Arg-Ala- Asp [cRAD], p < .001, n ≥ 5), indicating avoidance of the mononuclear phagocyte system by the buried-ligand architecture (BLA). ELA 5 exposed- ligand architecture.

