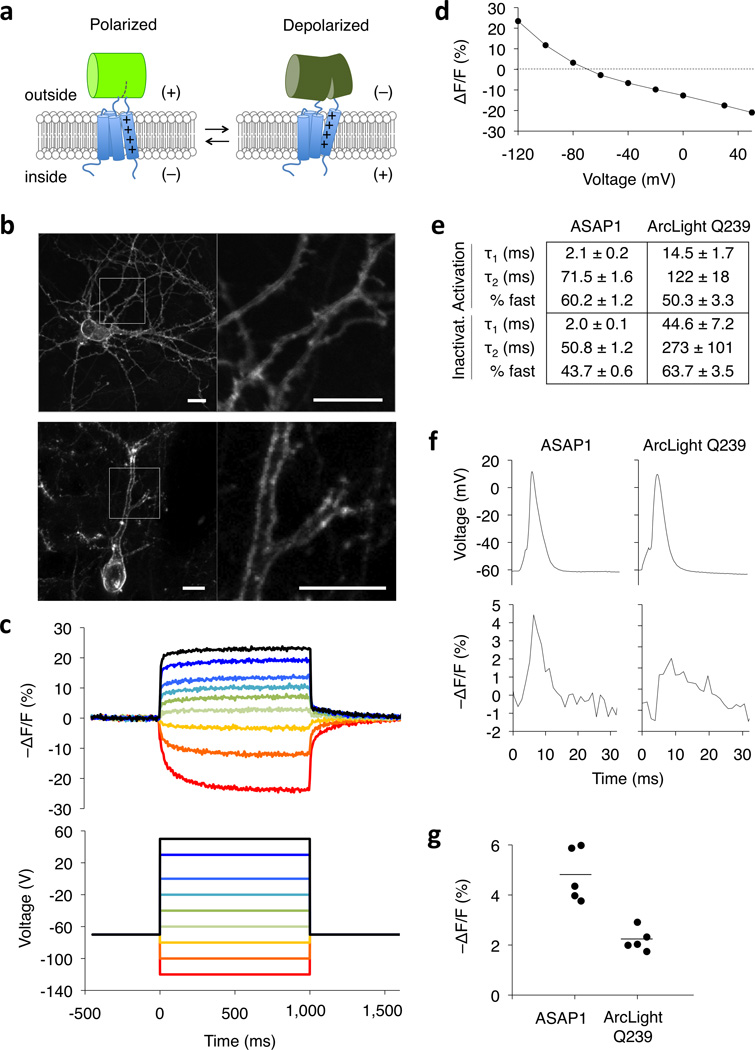
Figure 1.
ASAP1 design and voltage response characteristics. (a) ASAP1 is a circularly permuted GFP inserted into the extracellular S3-S4 loop of a voltage-sensing domain. Depolarization leads to decreased fluorescence. (b) ASAP1 was localized to the plasma membrane in a 12-day-in-vitro dissociated rat hippocampal neuron imaged by confocal microscopy (top) and in a fixed brain slice from an 8-week-old mouse transfected in utero and imaged by two-photon microscopy (bottom). Right panels show details from the left panels. Scale bar, 10 μm. Quantification of membrane localization in 22 neurons is in Supplementary Fig. 5. (c) ASAP1 responses in a representative HEK293A cell (top) to voltage steps from −120 to 50 mV (bottom). Responses were measured at 5-ms intervals and were normalized to fluorescence at the −70 mV holding potential. (d) Mean ASAP1 response to transmembrane voltage in HEK293A cells (n = 10 cells). Error bars are standard error of the mean (SEM). (e) Comparison of activation and inactivation kinetics of ASAP1 (n = 4 cells) and ArcLight Q239 (n = 6) in HEK293A cells. Numbers are mean ± standard error of the mean. (f) Comparison of ASAP1 and ArcLight Q239 responses to representative single trial recordings of action potentials (APs) induced by current injection in cultured hippocampal neurons. AP full widths at half-maximum (FWHM) of the voltage traces (top) were 3.3 and 3.6 ms for ASAP1- and ArcLight Q239-expressing neurons, respectively. The corresponding FWHM of the fluorescence responses (bottom) were 3.7 ms and 6.5 ms for ASAP1 and ArcLight Q239, respectively. (g) ASAP1 produces larger responses to current-triggered APs in cultured hippocampal neurons than ArcLight Q239 (p = 0.001, n = 5 neurons from 3 litters for each sensor). Each data point is the average response of an individual neuron over 12–25 APs per neuron (91 APs total for ASAP1 and 87 APs total for ArcLight Q239). For each sensor, the mean response over all tested neurons is depicted using a horizontal bar.

