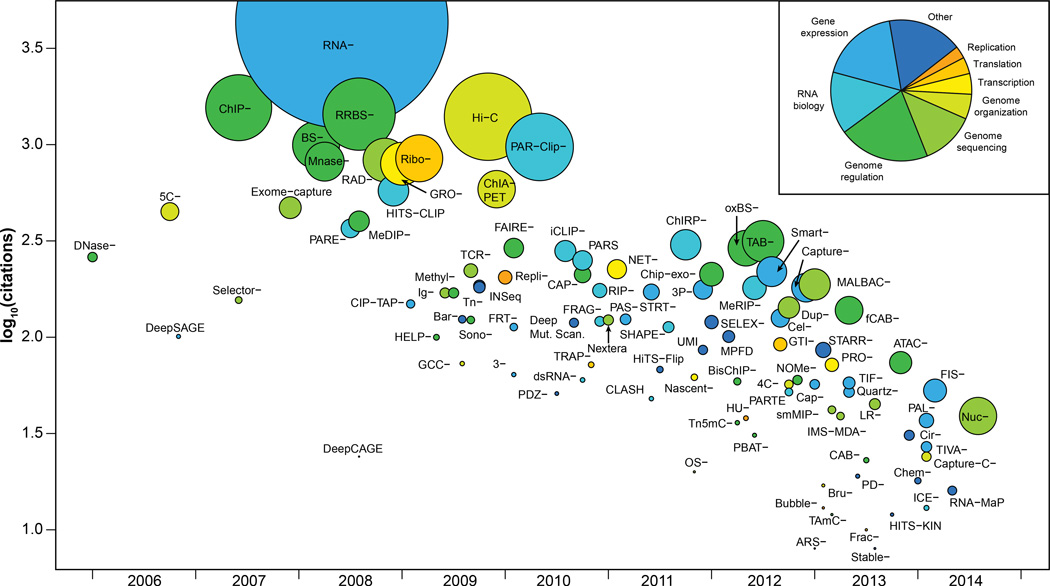
Figure 4. Broad overview of HTS applications.
Publication date of a founding article describing a method versus the number of citations that the article received. Methods are colored by category, and the size of the data point is proportional to publication rate (citations/months). The inset indicates the color key as well the proportion of methods in each group. For clarity, Seq has omitted from the labels.

