
FIG. 3.
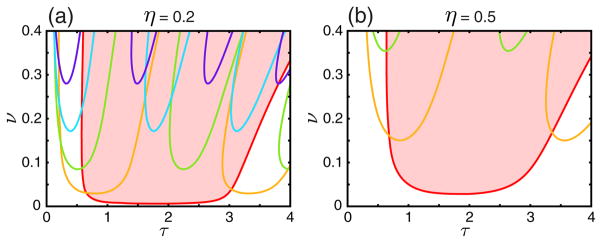
(color online). The linear stability bifurcation diagrams of the asynchronous state with respect to different modes as a function of τ and ν for two values of η [η = 0.2 in part (a), η = 0.5 in part (b)],, with instability of a mode occurring above each line. This is indicated for the one-mode instability by a red shaded region. The colors of each curve correspond to the mode numbers indicated in the legend in Figs. 2(a) and 2(b). Details of calculations are similar to Figs. 2(a) and 2(b). In particular, we find that the asynchronous state is stable when τ = 0 and most unstable when τ = 2 (which roughly corresponds to the half of the oscillator period) with respect to one-mode (single cluster).