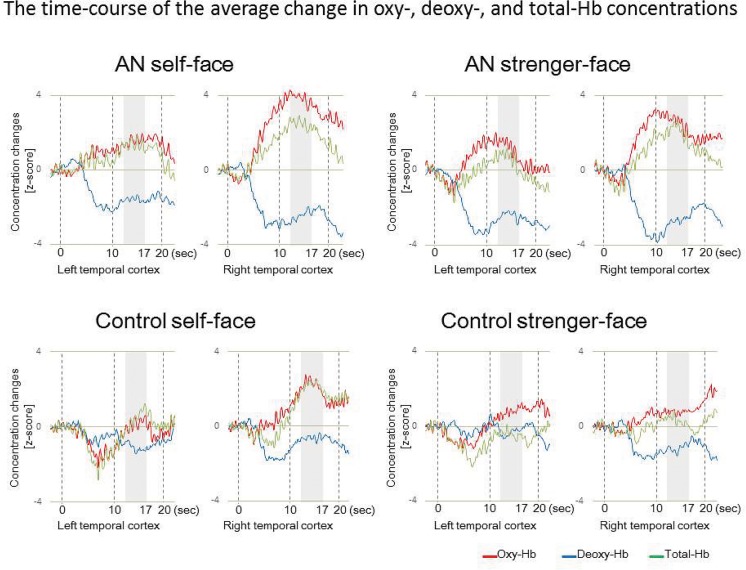
Fig 3. The time-course of the average change in oxy-Hb, deoxy-Hb, and total-Hb concentrations.
The time-course of the average change in oxy-Hb, deoxy-Hb, and total-Hb concentrations in the temporal regions of the participants during the presentation of the self-face and stranger-face conditions. Zero on the horizontal axis represents the onset of the test period and the duration of the test period was fixed at 15 s. The area in gray represents the zone that was averaged for statistical analysis.

