
Fig 4. A simplified smoke simulation, viewable only from above.
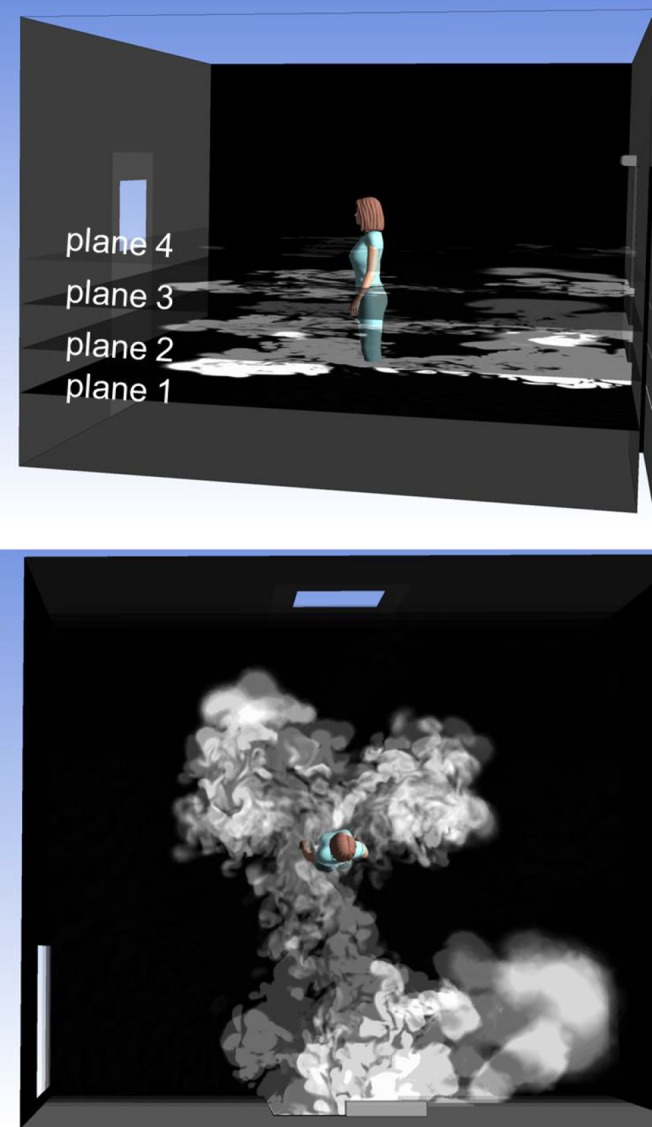
The upper figure shows four planar, greyscale contour maps of the tracer gas concentration at different heights. The lowest map is opaque, whereas the others are partially transparent. Together they simulate the smoke escaping from the isolation room, but only when viewed from above (lower figure).