
Fig 6. Smoke experiment in the isolation room side.
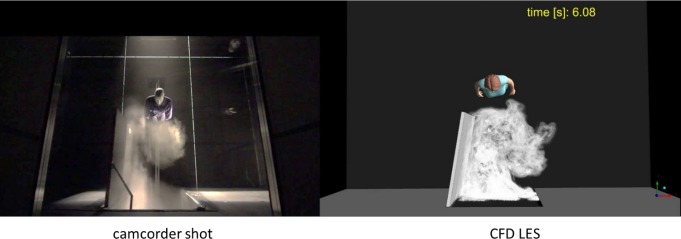
Experimental (on the left) and simulated (on the right) smoke visualizations of the nurse exiting the isolation room. This figure is one frame of S3 Video, showing the flow structures as a function of time. Note that only a certain height interval is lit.