Figure 2.
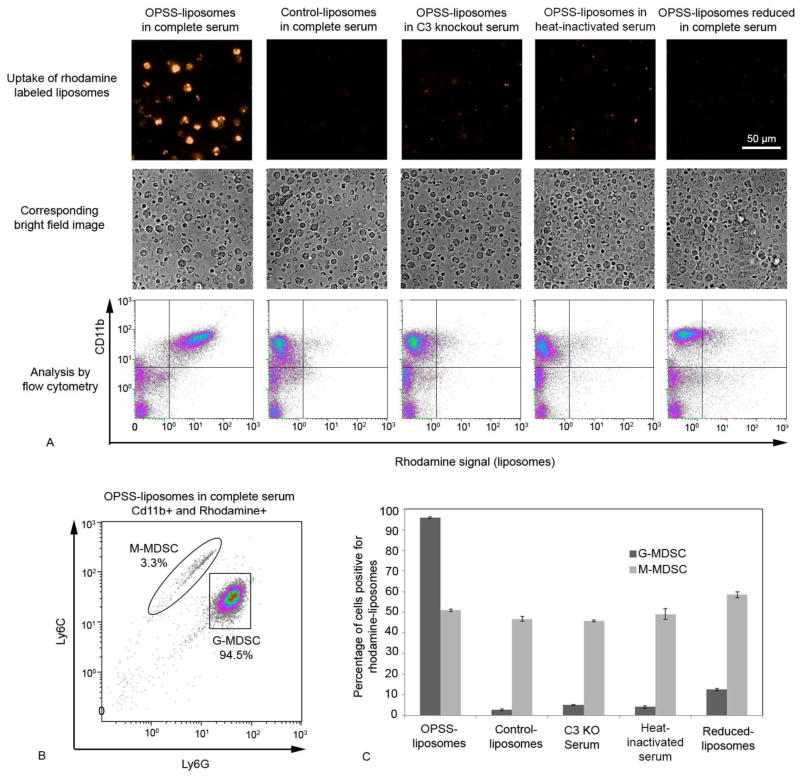
In vitro analysis of OPSS-liposome uptake by MDSCs. Rhodamine labeled OPSS-and control-liposomes were incubated in serum and then exposed to blood cells from mice with 4T1 mammary tumors to determine the cell populations that took up liposomes. Controls included OPSS-liposomes incubated in C3 knockout serum, OPSS-liposomes incubated in heat-inactivated serum and OPSS-liposomes that were exposed to serum and then reduced. Representative fluorescent and brightfield images with corresponding flow cytometry data illustrate the level of rhodamine uptake by Cd11b positive cells under different experimental conditions. Quadrant lines were used to estimate the percentage of cells that were positive for both CD11b and rhodamine signal (upper right quadrant). Experiments were done in triplicate to yield the data reported in the text (mean +/− s.e.) (A). Cells in each experiment that were positive for both CD11b and rhodamine were re-plotted according to their Ly6C and Ly6G levels, thereby differentiating G-MDSC and M-MDSC populations. Enclosure lines were used to estimate the percentages of G-MDSC and M-MDSCs (B). Bars represent the mean percentages of G-MDSC versus M-MDSC populations positive for rhodamine liposomes from triplicate analyses of data under different experimental conditions (C). Data are expressed as mean ± SE (n=3).

