Figure 3.
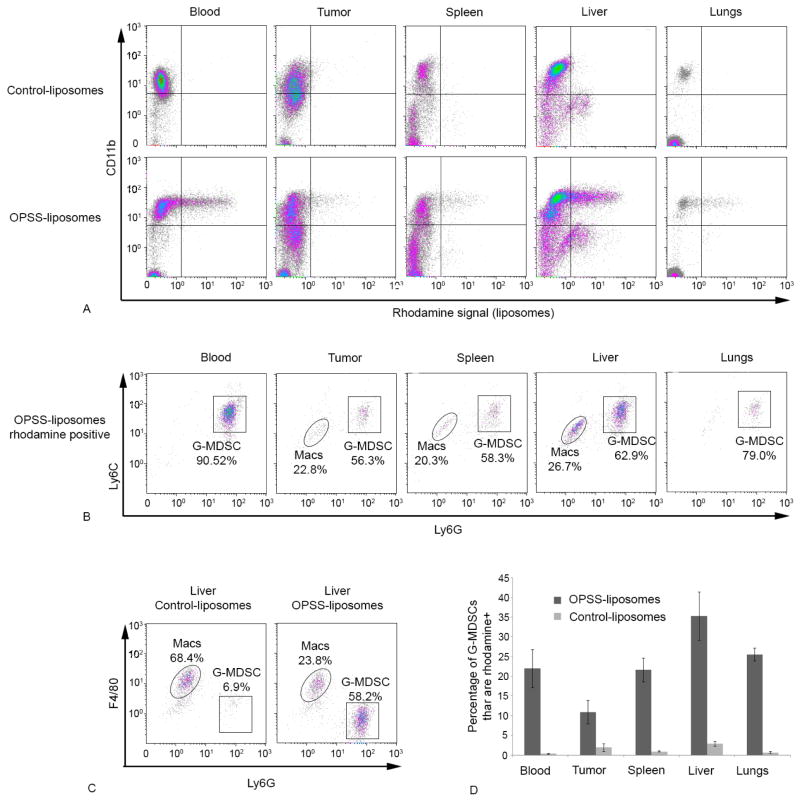
In vivo uptake of OPSS- and control-liposomes by G-MDSCs. OPSS- and control-liposomes were administered intravenously and the blood, tumor, spleen, liver and lung cells were analyzed by flow cytometry after 4 hours to determine which cells were positive for liposome uptake. Representative flow cytometry graphs (panel A) show CD11b signal plotted against rhodamine signal. Analysis of the rhodamine positive cells (both upper and lower right quadrants of graphs in panel A) using the Ly6G and Ly6C markers showed that G-MDSCs are the predominant cell population that took up OPSS-liposomes (B). However, triplicate analysis of liver cells by F480 and Ly6G revealed that a significant percentage of the rhodamine positive cells were macrophages (Macs) (C). The bar graph (D) shows the percentage of G-MDSCs that have taken up liposomes in animals that were injected with either OPSS- or control-liposomes. Data are expressed as mean ± SE (n=3), and actual numbers are given in Table I.

