
Figure 2. CSN6-mediated ROS production and DNA damage involve COP1 and Aurora A.
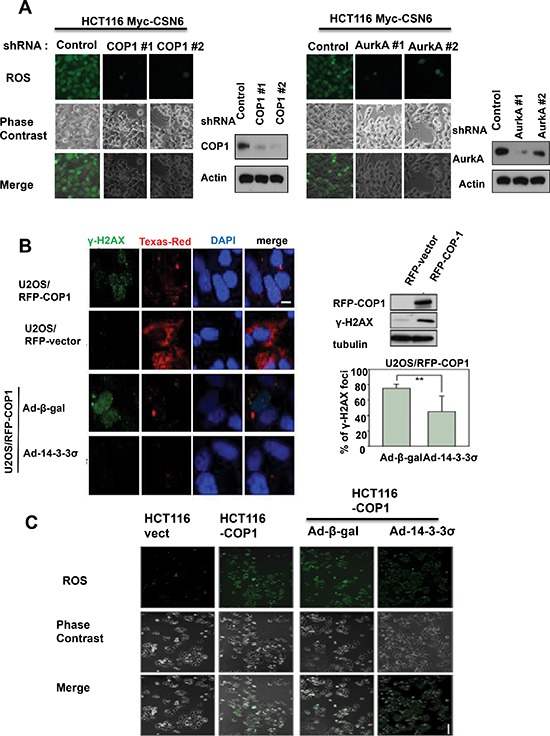
(A) Knockdown of COP1 or Aurora A attenuates CSN6-mediated ROS production. ROS production (green fluorescence) was detected by DCFDA and fluorescence microscopy in indicated cells. Phase-contrast images and merged images of the same microscopic fields are shown. (B) 14-3-3σ blocks the increase in γ-H2AX foci induced by COP1. Stably expressing RFP-COP1 (U2OS/RFP-COP1) and RFP vector (U2OS/RFP-vector) U2OS cells were examined for the distribution of γ-H2AX foci (green) by confocal microscope with anti-γ-H2AX and Alexa Fluor 488-conjugated secondary antibodies. DNA was counterstained with the DAPI dye (blue). Cell lysates of U2OS (RFP-vector and RFP-COP1) cells were also analyzed by immunoblotting using antibodies against γH2AX and RFP-COP1. U2OS/RFP-COP1 cells were also infected with Ad-β-gal or Ad-HA-14-3-3σ to examine their impacts on γH2AX foci formation. The bar graph shows percentage of nuclear γH2AX foci in Adenovirus-infected groups. Error bars represent 95% confidence intervals. 200 hundreds have been counted. Two asterisk, p < 0.01 (Student's t-test). Scale bar, 10 μm. (C) 14-3-3σ inhibits COP1-mediated ROS production. ROS production (green fluorescence) was detected by DCFDA and fluorescence microscopy in stably expressing Myc-vector HCT116 cells, Myc-COP1 HCT116 cells, Myc-COP1 HCT116 cells infected with Ad-β-gal or Ad-HA-14-3-3σ. Phase-contrast images and merged images of the same microscopic fields are shown. Scale bar, 50 μm.