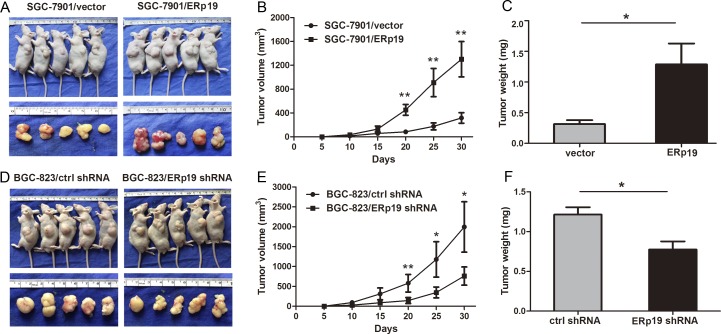
Figure 4. Effects of ERp19 on tumor growth in vivo.
A and D, Representative photographs of tumors derived from SGC7901/vector, SGC7901/ERp19, BGC-823/ctrl shRNA and BGC-823/ERp19 shRNA cells, respectively. B and E, The growth curves of tumors after injection of GC7901/vector, SGC7901/ERp19, BGC-823/ctrl shRNA and BGC-823/ERp19 shRNA cells in nude mice (*P < 0.05, **P < 0.01; n=5 per group). Tumor sizes were measured every 5 days during the 30 days. C and F, Average weights of tumors derived from SGC7901/vector, SGC7901/ERp19, BGC-823/ctrl shRNA and BGC-823/ERp19 shRNA cells in nude mice (*P < 0.05). Data are shown as the mean ± SD.

