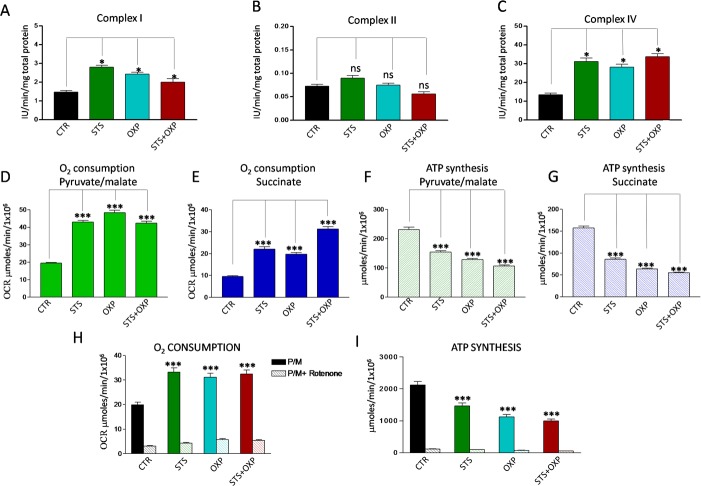
Figure 4. Effect of STS in combination with chemotherapy on oxidative phosphorylation activity of CT26 colon carcinoma cells.
Panels A, B and C report the activity of the redox Complexes I, II and IV in CT26 cell lines treated with STS +/− OXP. Data are expressed as mean values ± SD. P value was calculated using unpaired t-test with Welch's correction. *: P<0.05. Panels D-E show the oxygen consumption rate (OCR) of CT26 in the presence of pyruvate (10mM)/malate (5mM) and succinate (20mM), respectively. OCR was measured by an oxygen micro-respiration electrode and expressed as μM O2/min/106 cells. Each is representative of at least three experiments. Panels F-G describe the activity of F0-F1 ATP synthase of CT26 cell lines, measured by luminometric analysis, after the addition of 10 mM pyruvate + 5 mM malate or 20 mM succinate. Panels H-I show the OCR and ATP synthesis in CT26 cells in the presence of pyruvate (10mM)/malate (5mM) and pre-incubated with Rotenone. Each is representative of at least six experiments. P value was calculated using unpaired t-test with Welch's correction. *: P<0.05.

