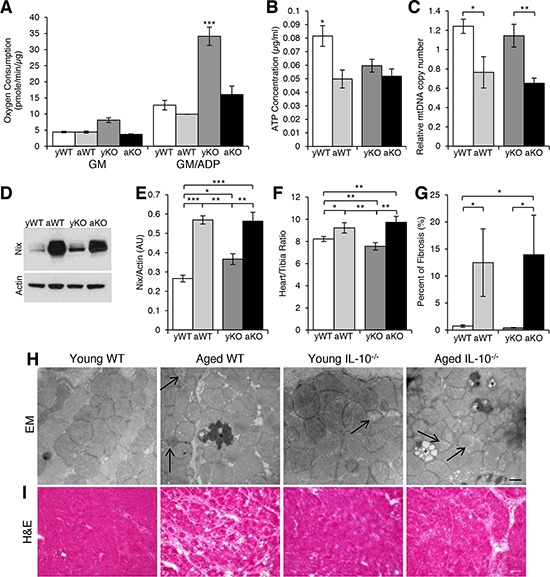
Figure 3. Altered mitochondrial parameters and cardiac remodeling.

A. Oxygen consumption from mitochondria isolated from cardiac muscle of young WT (yWT), aged WT (aWT), young IL-10−/− (yKO) and aged IL-10−/− (aKO) after the addition of glutamate/malate (GM) in State 4 and GM and ADP in State 3 respiration. B. ATP concentration in cardiac muscle. C. Relative mitochondria DNA (mtDNA) copy number as a measure of the ratio between cytochrome B and GapDH. D. Western blot analyses using an antibody against Nix and E. the relative expression in arbitrary units (AU). Actin was used as a loading control. F. Cardiac hypertrophy measured as a ratio of heart weight to tibia length. G. Quantification of fibrosis evident in (I.). H. Representative EM pictures of mitochondria in cardiac muscle. Arrow shows depleted mitochondria. “+” is labeling lipofuscin granulas. Scale bar: 500 nm. I. Histological analyses of cardiac muscle cryosections using H&E. Scale bar: 100 μm. Data are means ± SEM. *p < 0.05; **p < 0.01; ***p < 0.001.
