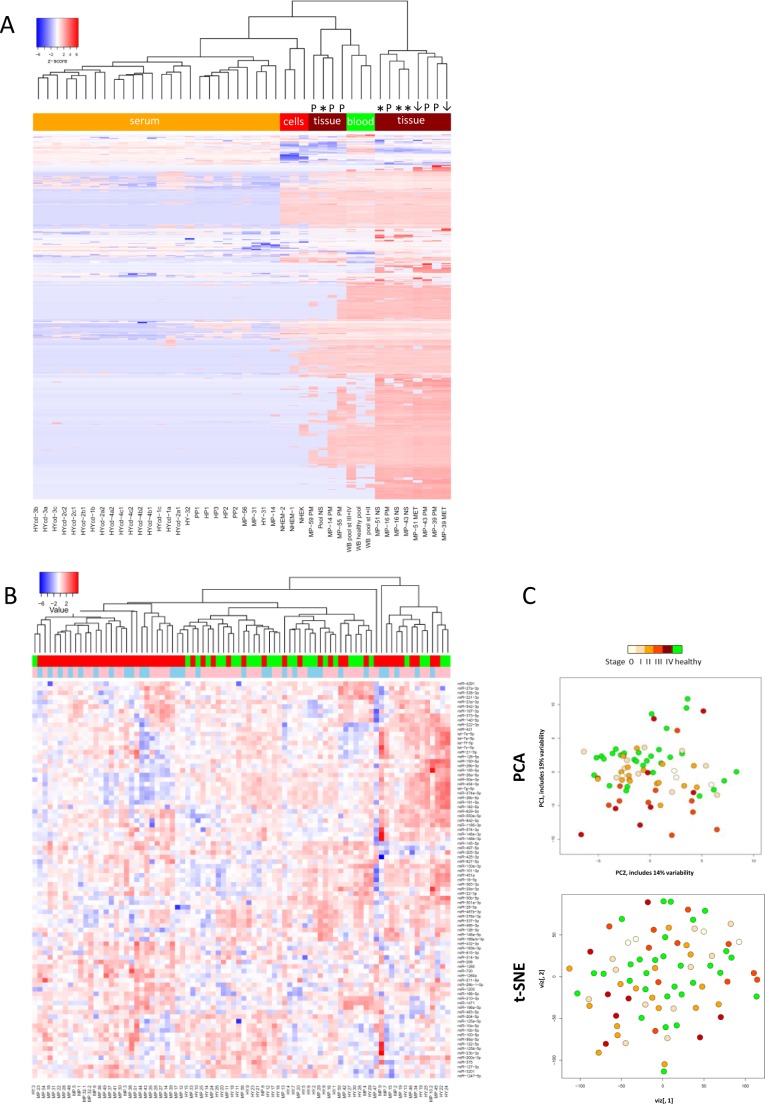
Figure 3. MiRNA profiling of melanoma samples.
A) Heatmap of whole miRNome qPCR array data of all 44 samples (see Fig. 1) normalized by global plate mean (miRNAs absent across all samples are not depicted). WB: whole blood, NS: normal skin tissue, MET: metastatic tissue, PM: primary melanoma tissue, st: stage; NHEK: normal human epidermal keratinocyte cell line; NHEM: normal human epidermal melanocyte cell line, HY: healthy, HYcd: healthy circadian, MP: melanoma patient, HP: healthy pool, PP: patient pool. * represent normal skin, arrows metastatic tissue and “P” indicates primary tumour. B) Heatmap and C) PCA and t-SNE plots of 82 individual serum samples (30 healthy volunteers and 52 melanoma patients) analysed by custom qPCR arrays. Data were normalized using the 5 most stable miRNAs. Colours: blue-male; pink-female; green-healthy; red-patient.

