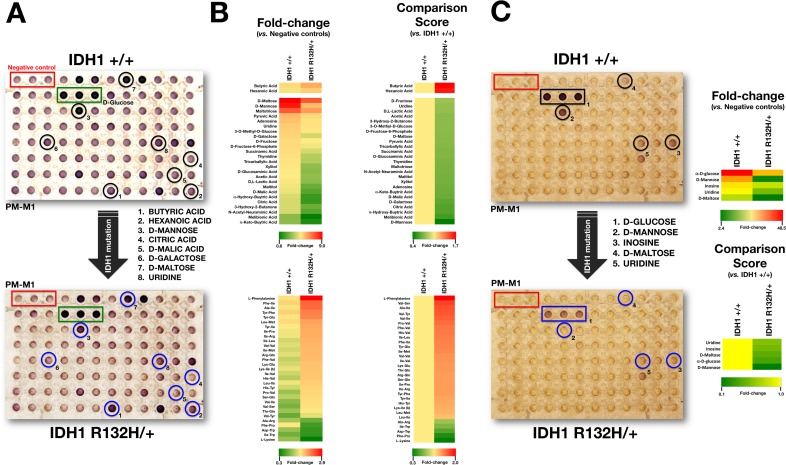
Figure 1. Metabolic fingerprint of the oncometabolic mutation IDH1 R132H in MCF10A breast epithelial cells.
A. Representative micrographs of non-starved IDH1 +/+ and R132H/+ cells following 48 hours culture in PM-M1 plates containing primarily carbohydrate and carboxylate substrates (see text for a detailed explanation). B. Phenetic maps of carbon utilization patterns of IDH1+/+ and R132H/+ cells obtained after evaluation of OD values in PM-M1, PM-M2, PM-M3, and PM-M4 plates (see text for a detailed explanation). Phenotypes that are lost are colored green and phenotypes that are gained are colored red; the exact relative values are given by a corresponding color as indicated at the color scales. C. Left. Representative micrographs of starved IDH1 +/+ and R132H/+ cells following 48 hours culture in PM-M1 plates containing primarily carbohydrate and carboxylate substrates (see text for a detailed explanation). Right. Phenetic maps of starved-IDH1 +/+ and R132H/+ cells were generated as shown in B.

