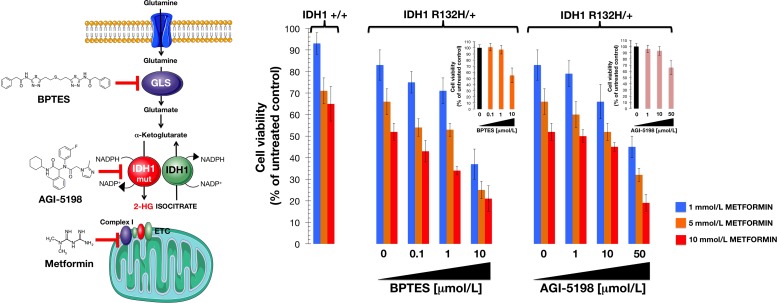
Figure 5. Interaction between metformin and drugs targeting the glutamine-driven production of 2HG in IDH1 mutant cells.
Left. Pathway showing production of the oncometabolite 2HG from glutamine, and inhibitor targets. GLS, glutaminase; IDH1, isocitrate dehydrogenase; IDH1 mut, mutant IDH1; ETC, electron transport chain. Right. Relative cell viability of cell lines treated with a combination of metformin and either the glutaminase inhibitor BPTES or the IDH1-mutant inhibitor AGI-5198. Cell viability was normalized to the condition with no metformin and no added BPTES or AGI-5198. Mean (columns) and SD (bars) were calculated from three biological replicates.

