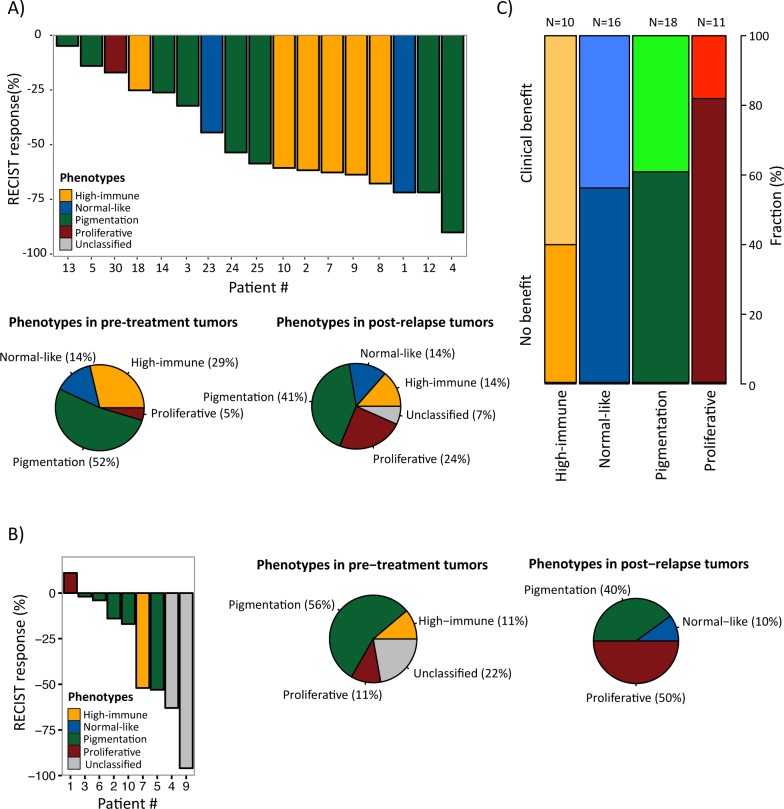
Figure 4. Gene expression phenotypes and prediction of clinical benefit from molecular targeted therapies.
A) Melanoma tumors from patients treated with BRAFi [16] or B) BRAFi/MEKi [17] were classified into the gene expression phenotypes and further analyzed for objective response (RECIST response, %) (4A, upper panel; 4B left panel) and phenotype distribution in pre-treatment and post-relapse biopsies (4A, lower panel; 4B, middle and right panel). C) Gene expression phenotype distribution in patients treated with MAGE-A3 vaccine [14]. The fraction of patients with clinical and no benefit is indicated for each phenotype.

