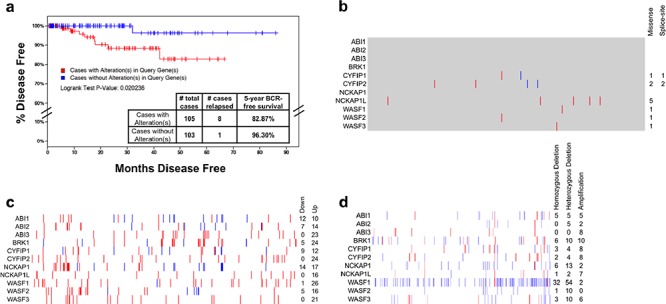
Figure 1. Spectrum of alterations of WAVE complex in primary prostate cancer.

Data on prostate adenocarcinoma analyses performed as part of The Cancer Genome Atlas (TCGA) as of the time of writing was downloaded from cBioPortal [64], the NCBI TCGA data portal (https://tcga-data.nci.nih.gov) and CGHub [65]. a. Kaplan-Meier survival distribution showing the time until biochemical recurrence for patients with alterations in WAVE complex genes (ABI1, ABI2, ABI3, BRK1, CYFIP1, CYFIP2, NCKAP1, NCKAP1L, WASF1, WASF2, and WASF3). Log rank P value: 0.020 suggesting a significant difference between groups. b. Distribution of nonsynonymous somatic mutations to WAVE complex genes from 493 cases of PCa whole exome sequencing data generated by the TCGA. Blue: splice-site mutation; red: missense mutation; gray: unchanged. c. Gene expression changes in tumor samples relative to the mean of the sample set's 75th percentile-normalized RSEM values (z-score/standard deviations, s.d.) from 493 cases of TCGA PCa RNA-seq data [66]. Normalized RSEM values are given in Supplementary Table 1, and z-score values are given in Supplementary Table 2. Blue: ≥ 2 s.d. down-regulated; Red: ≥ 2 s.d. up-regulated. Note that due to variability in the purity of the tumor sample (Supplementary Table 3) as determined by ESTIMATE [67], some up- or down-regulation of WAVE complex genes may be due to stromal contamination. d. Somatic copy number analysis of WAVE complex genes from 319 cases of TCGA PCa Affymetrix 6.0 SNP arrays, where 1 (white) = two copies. Red: > 1.2, inferring amplification; Blue: < 0.8, inferring deletion. Homozygous deletion: copy number less than 0.6. Hemizygous deletion: copy number 0.6–0.8. Cases with tumor cell purity less than 90% are excluded from totals, but values for all cases are given in Supplementary Table 4.
