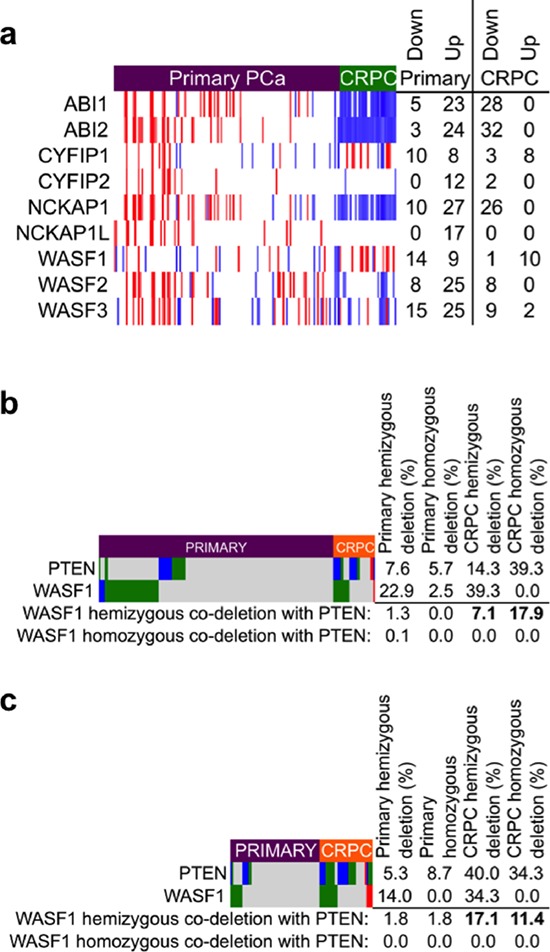
Figure 2. WAVE complex disruption in castration-resistant prostate cancer.

a. Heatmap of gene expression changes in WAVE complex genes relative to the mean of the sample. Microarray data for primary PCa (Affymetrix Human Exon 1.0 array, accession ID GSE21034) and CRPC (Affymetrix U133A array, accession ID GSE32269) were downloaded from the Gene Expression Omnibus (GEO) and normalized to the same scale using SCAN for Bioconductor [68]. Gene expression values in each row are displayed according to their z-score (number of standard deviations (s.d.) greater or lower than the mean for the sample set). Note that probes to BRK1 and ABI3 were not present on the Affymetrix U133A microarray and thus are excluded from this analysis. Red: high expression (greater than 1 s.d. up-regulated); blue: low expression (greater than 1 s.d. downregulated). Normalized intensity values are given in Supplementary Table 5 and z-scores are values are given in Supplementary Table 6. b. Somatic copy number depiction of PTEN and WASF1 of 157 primary PCa and 28 CRPC from the MKSCC dataset [7] (Agilent 244A aCGH array, accession ID GSE21032). P < 0.0001 by Fisher's exact test for the frequency of co-occurrence of hemizygous WASF1 deletion with combined frequencies of hemizygous and homozygous deletion of PTEN in CRPC vs. primary PCa. Numeric copy number calls are given in Supplementary Table 7. c. Somatic copy number depiction of PTEN and WASF1 of 59 primary PCa and 35 lethal CRPC from the UMICH dataset [10] (Agilent 44K aCGH array, accession ID GSE35988). P = 0.0006 by Fisher's exact test for the frequency of co-occurrence of hemizygous WASF1 deletion with combined frequencies of hemizygous and homozygous deletion of PTEN in CRPC vs. primary PCa. Numeric copy number calls are given in Supplementary Table 8. For (b) and (c) data were downloaded from GEO and loci copy number were assessed with Nexus Copy Number software (Biodiscovery, Hawthorne, CA); dark blue: homozygous deletion; green: hemizygous deletion; red: amplification; gray: unchanged.
