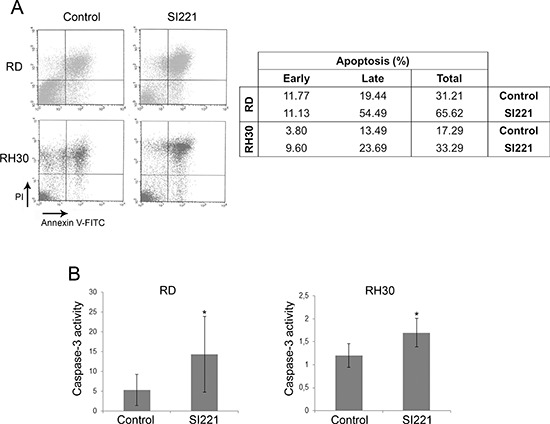
Figure 2. Apoptosis induction in RMS cell lines treated with SI221.

(A) A representative FACS analysis to investigate apoptosis by cell staining with annexin V-FITC and propidium iodide (PI) of RD and RH30 cells 72 hours after treatment with SI221 or DMSO, as a control. The table reports the values relative to early apoptosis (annexin V positive and PI negative), late apoptosis (annexin V positive and PI positive) and total apoptosis. (B) Histograms showing caspase-3 activity in RD and RH30 cell lines 72 hours after treatment with SI221 or DMSO, as a control. Caspase-3 activity is expressed as pmol pNA/μg protein × time (hours). The reported values represent the means and standard deviations of three independent experiments. Statistically significant differences were evaluated by Student t test and indicated with *: significant (P < 0.05).
