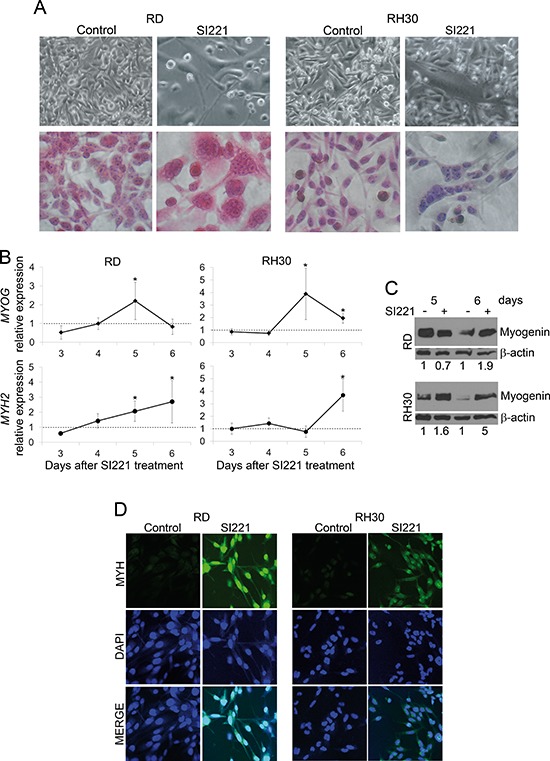
Figure 4. SFK inhibition-induced morphological changes and myogenic marker expression in RMS cell lines.

(A) Representative micrographs of RD and RH30 cells, both unstained (upper panel) and stained with hematoxylin and eosin (lower panel), 6 days after treatment with SI221 or DMSO, as a control. Original magnification: 40X. (B) Real-time qRT-PCR analysis of MYOG (encoding myogenin) and MYH2 (encoding myosin heavy chain 2) expression in RD and RH30 cell lines 3, 4, 5 and 6 days after treatment with SI221. Results are reported as means of three independent experiments, each conducted in triplicate. At each evaluation time, MYOG and MYH2 expression in treated cells was calculated by the 2−ΔΔCt method [35] relatively to control cells, which were treated with DMSO alone and collected at the same time points. MYOG and MYH2 expression values in control cells were defined as 1 and used as a baseline (dashed line). Statistically significant differences were evaluated by subjecting the ΔCt values of treated and control samples to Student t test, as previously indicated [38]. *: significant (P < 0.05). (C) A representative western blotting analysis of myogenin in RD and RH30 cell lines 5 and 6 days after treatment with SI221 or DMSO alone. An anti-β-actin antibody was used for a loading control. The density of the bands was quantified by densitometric analysis. Myogenin band densities were normalized with the β-actin band densities. Data are presented as relative values with respect to untreated control values, set at 1. (D) Representative micrographs of RD and RH30 cells treated with SI221 or DMSO, as a control, and stained by immunofluorescence with an antibody against myosin heavy chain (MYH) and by the fluorescent nuclear stain DAPI 6 days after treatment. Original magnification: 40X.
