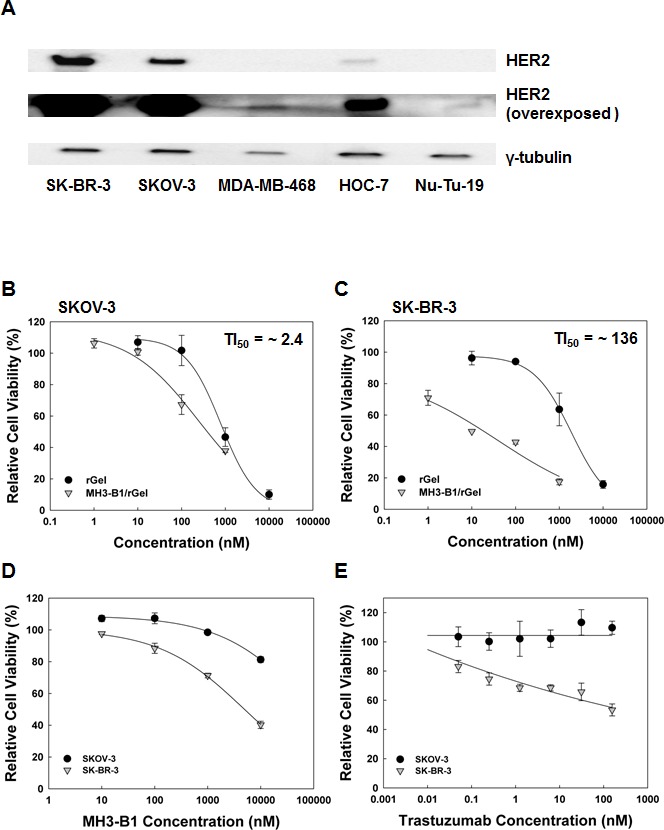
Figure 1. Cellular HER2 expression and cytotoxicity of HER2-targeted compounds.

(A). Western blot showing basal HER2 expression in SK-BR-3, SKOV-3, MDA-MB-468, HOC-7 and Nu-Tu-19 cells, representative blot of two experiments. Relative cell viability (MTT) of SKOV-3 and SK-BR-3 cells following 72 hrs incubation with MH3-B1/rGel and rGel (B and C), MH3-B1 (D) and trastuzumab (E), representative sigmoidal curves of three experiments (fit model: a/(1+exp(−(x-x0)/b))), error bars = SD.
