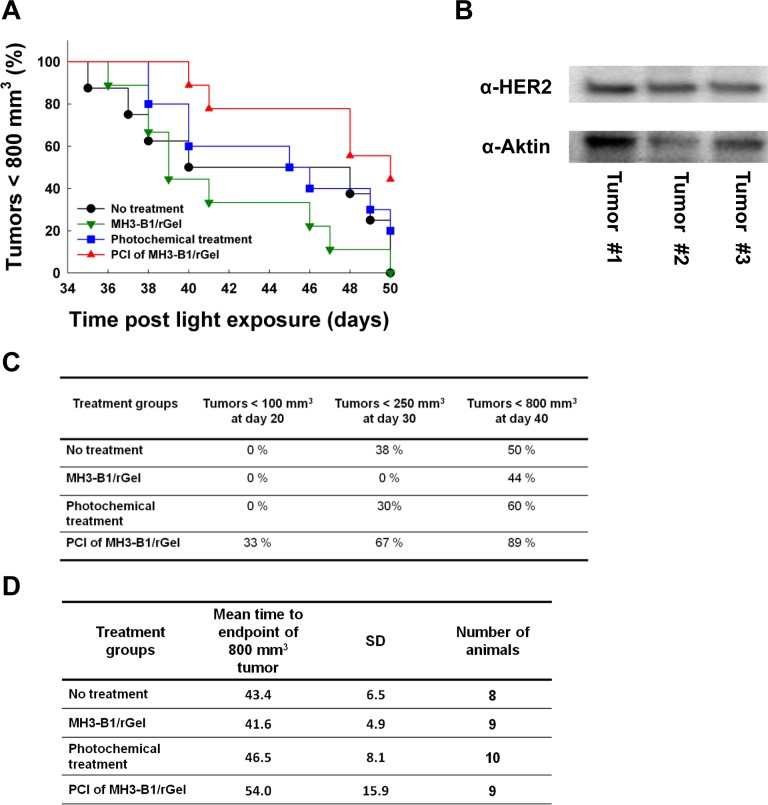
Figure 6. Treatment response following PCI of MH3-B1/rGel in SKOV-3 xenografts.
Kaplan Meyer plot illustrating response from day 34-50 in the four treatment groups (A). Tumor volume end point = 800 mm3. Western blot of HER2 in three SKOV-3 tumors (B). Percent of animals bearing tumors < 100 mm3 at day 20, < 250 mm3 at day 30 and < 800 mm3 at day 40 post light exposure in the four treatment groups (C). Average time to reach the endpoint of 800 mm3 tumor volume in the four treatment groups (D).

