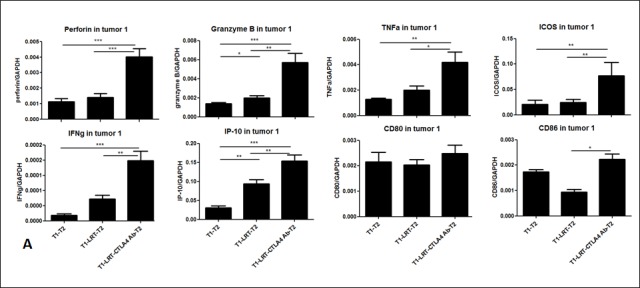
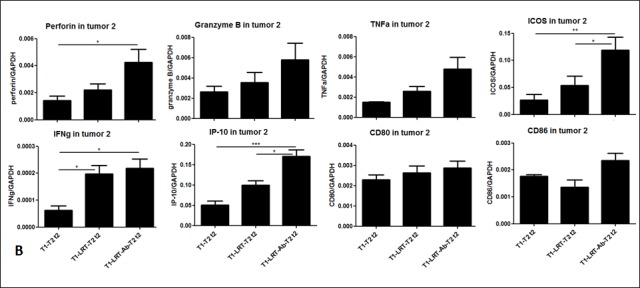
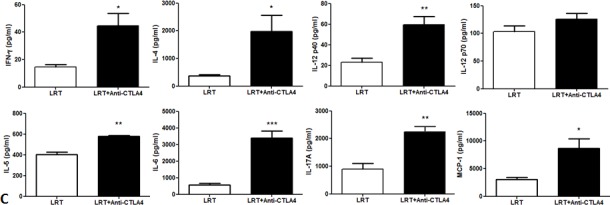
Figure 6. The expression of the immune-related genes was evaluated by RT-PCR in tumor T1.


(A) and T2 (B); and the production of cytokine profile was determined by Luminex assay, where the concentrations are shown in pg/ml of culture medium (C).


(A) and T2 (B); and the production of cytokine profile was determined by Luminex assay, where the concentrations are shown in pg/ml of culture medium (C).