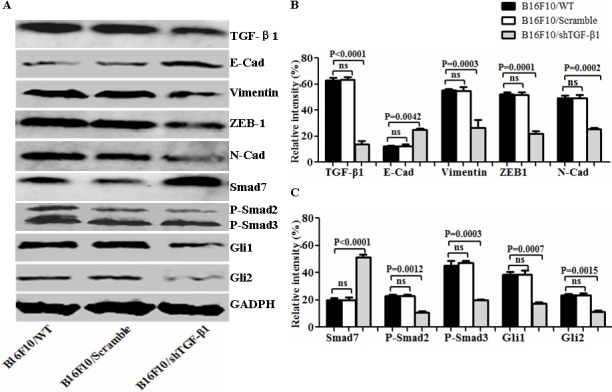
Figure 1. Analysis of EMT-associated molecule expression in differently treated B16F10 cells.

A. EMT associated molecular expression analyzed by Western blot in B16F10/wild type (WT), B16F10/Scramble, and the B16F10/shTGF-β1 cells. B and C. Semi-quantification analysis of relative intensity of molecular expression; refer to the statistical differences as indicated. Relative intensity of GADPH expression was served as the 100%, and other molecular expression was compared with GADPH expression.
