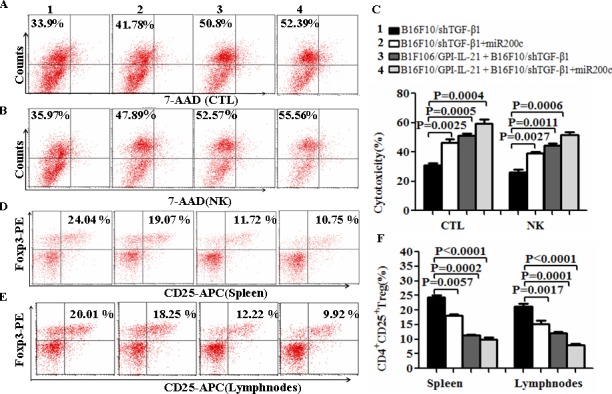
Figure 4. The activities of CTL and NK and CD4+CD25+Treg cell level in vaccinated mice challenged with B16F10/shTGF-β1 cells.

A and B. The CTL and NK cytotoxic activities were analyzed by Flow Cytometry for the differently treated groups, and the quantification analysis was shown in C, D and E. The level of CD4+CD25+Treg cells was analyzed by a Flow Cytometry in splenocytes (D) and tumor draining lymph nodes (E); refer to the statistical differences as shown in F. n=9.
