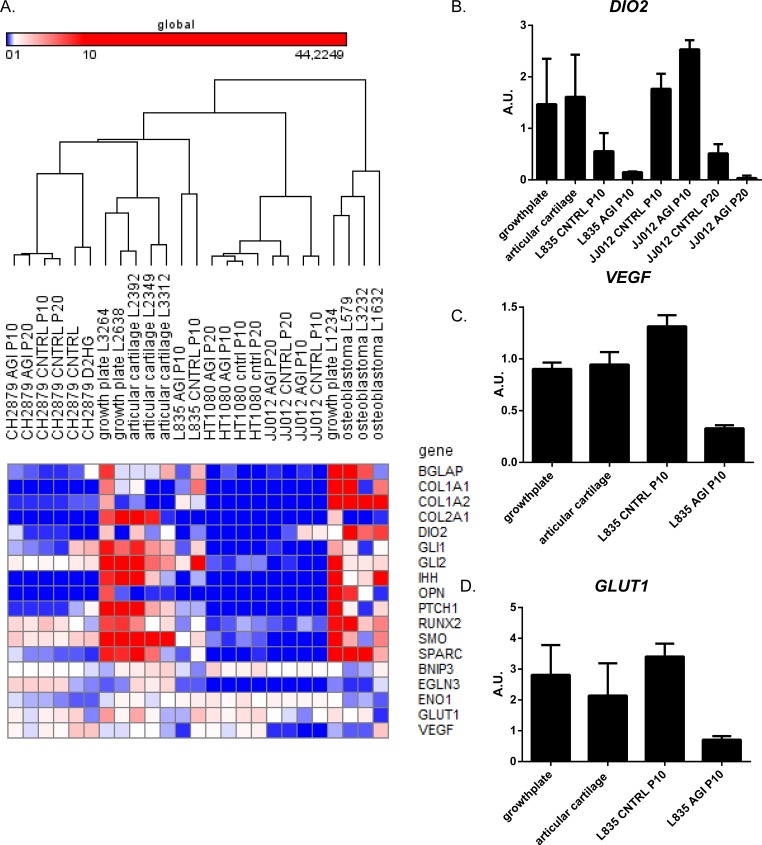
Figure 6. The effect of long term mutant IDH1 inhibition on hedgehog signaling, HIF1α signaling and chondrogenic and osteogenic differentiation markers. (.
A) qPCR results shown in a heatmap of expression levels of genes involved in Hedgehog signaling, HIF1α signaling and osteogenic or chondrogenic differentiation. Comparison of the expression levels of genes involved in Hedgehog signaling, as well as osteogenic and chondrogenic differentiation markers revealed lower expression levels in the cell lines compared to 3 growth plates, 3 articular cartilage and 3 osteoblastomas. HIF1α target genes showed comparable expression levels between cell lines and controls. No differences in expression levels were observed after treatment with D-2-HG. The color scheme was set on global with the lowest expression levels in blue (RKPM value starts at 0), with the intermediate scale set on white (RKPM value starts at 1) and the highest expression levels in red (RKPM value starts at 10). (B) Expression levels of DIO2 in samples after mutant IDH1 inhibition and in the growth plate and articular cartilage controls. DIO2 expression levels decreased upon inhibition of mutant IDH1 in L835 after 10 passages and in JJ012 after 20 passages. (C) Expression levels of VEGF were decreased after mutant IDH1 inhibition in L835. (D) Expression levels of GLUT1 were decreased after mutant IDH1 inhibition in L835.

