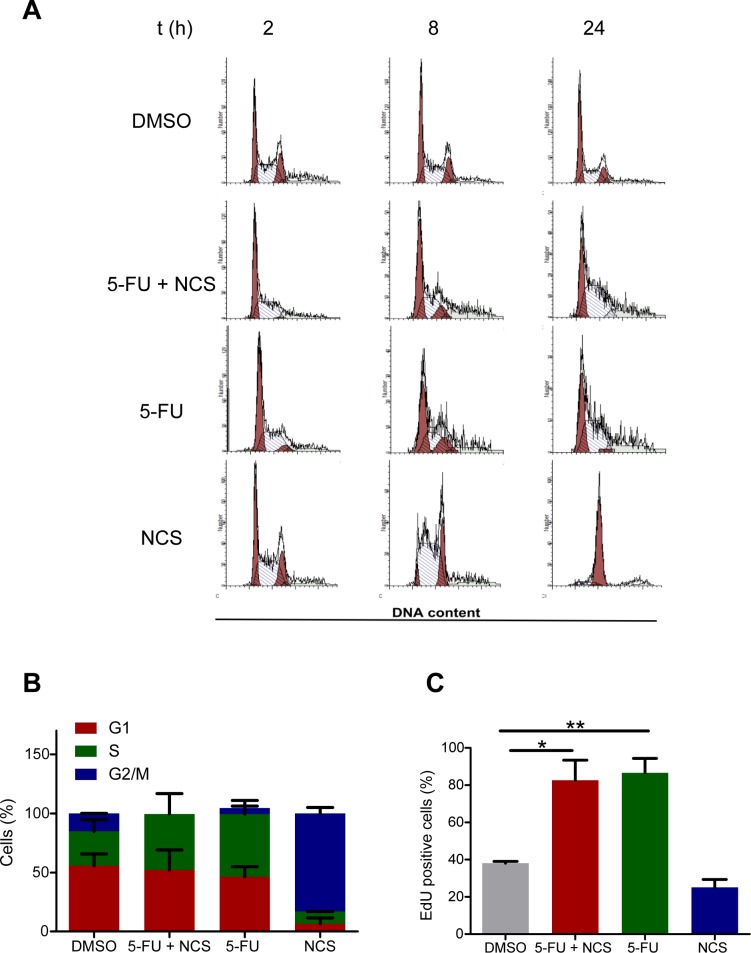
Figure 4. Reduced HRR is not a consequence of a shift in cell cycle distribution.
(A) Propidium iodide staining and flow cytometry of SW480 cells treated with DMSO, 5 μM 5-FU and/or 100 ng/ml NCS as detailed in Figure 1A. (B) Quantification of the cell cycle distribution. (C) EdU assay in SW480 cells to determine the percentage of cells in S phase. The cells were first treated as shown in Figure 1A; 2 h prior to fixation, 15 μM EdU was added to the cells. The cells were then fixed on the plate, and EdU was detected by Alexa 488 azide. Fluorescence intensity was quantified as described for γ-H2AX in Figure 1C.

